
TA: Ethereum Prints Bearish Technical Pattern, Why It Could Nosedive
Ethereum failed to recover above the $3,120 pivot zone against the US Dollar. ETH price is declining and it could extend its losses below $2,950. Ethereum struggled to recover above the $3,120 and $3,125 resistance levels. The price is now trading below $3,080 and the 100 hourly simple moving average. There is a major bearish trend line forming with resistance near $3,150 on the hourly chart of ETH/USD (data feed via Kraken). The pair could accelerate lower if there is a close below the $2,950 low. Ethereum Price Remains At Risk Ethereum started an upside correction from the $2,950 low,....
Related News
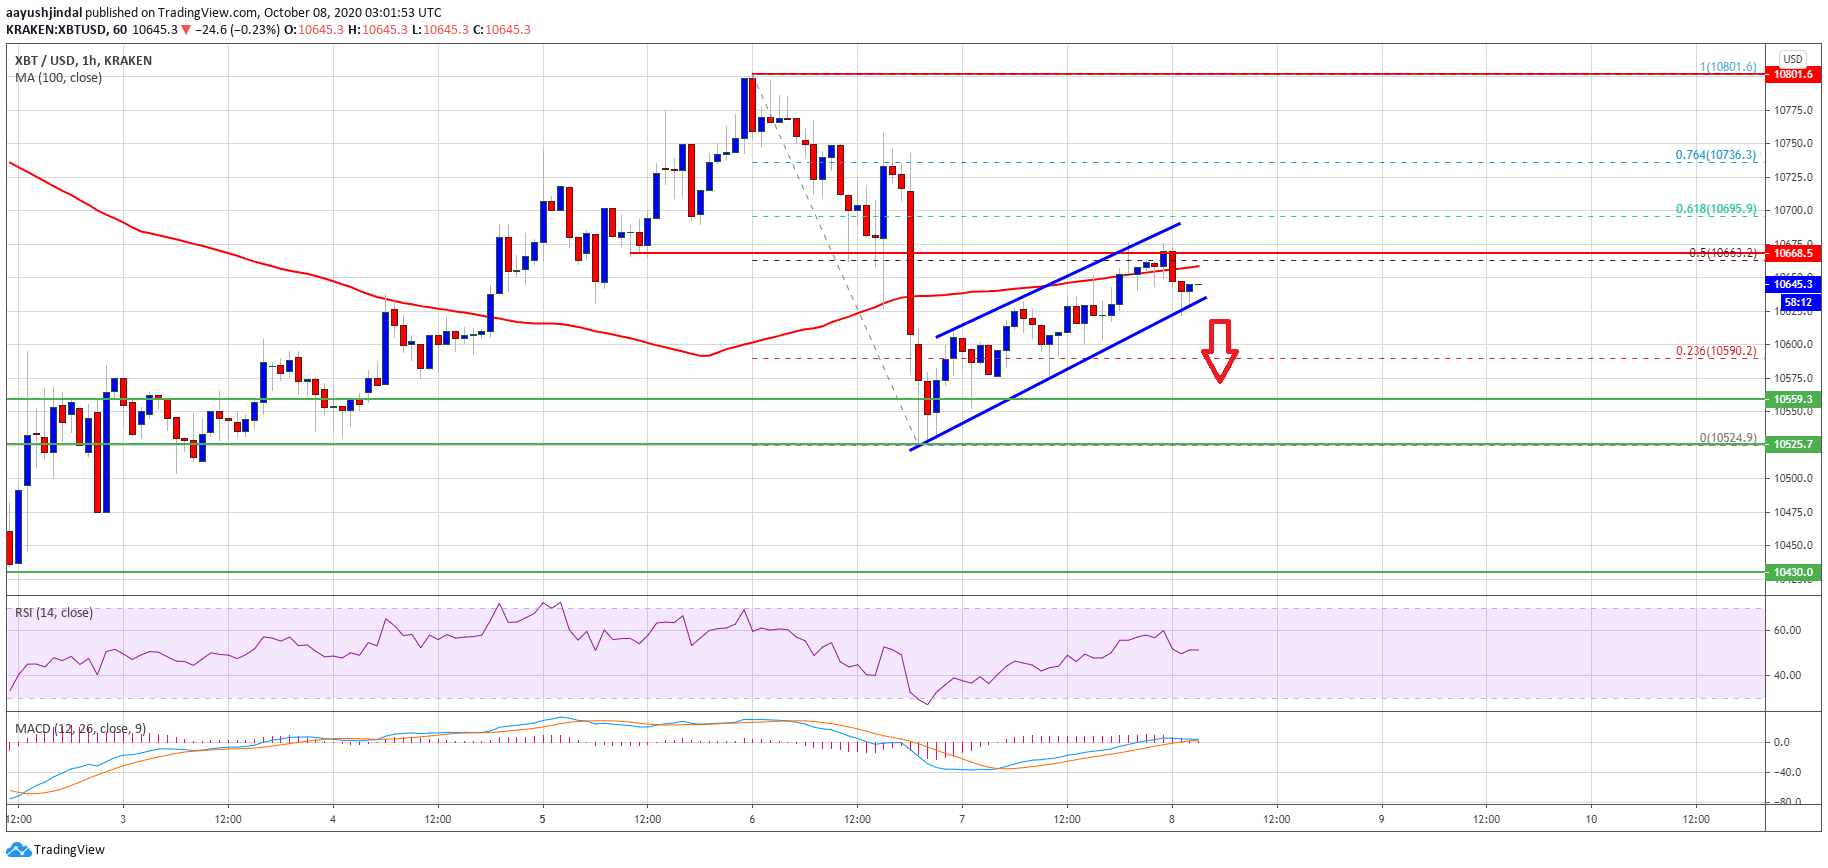
Bitcoin price is currently correcting higher from the $10,550 support against the US Dollar. BTC is currently facing hurdles and it is likely to resume its decline below $10,550. Bitcoin is showing many bearish signs below the $10,800 resistance zone. The price is now trading below the $10,675 resistance and the 100 hourly simple moving […]
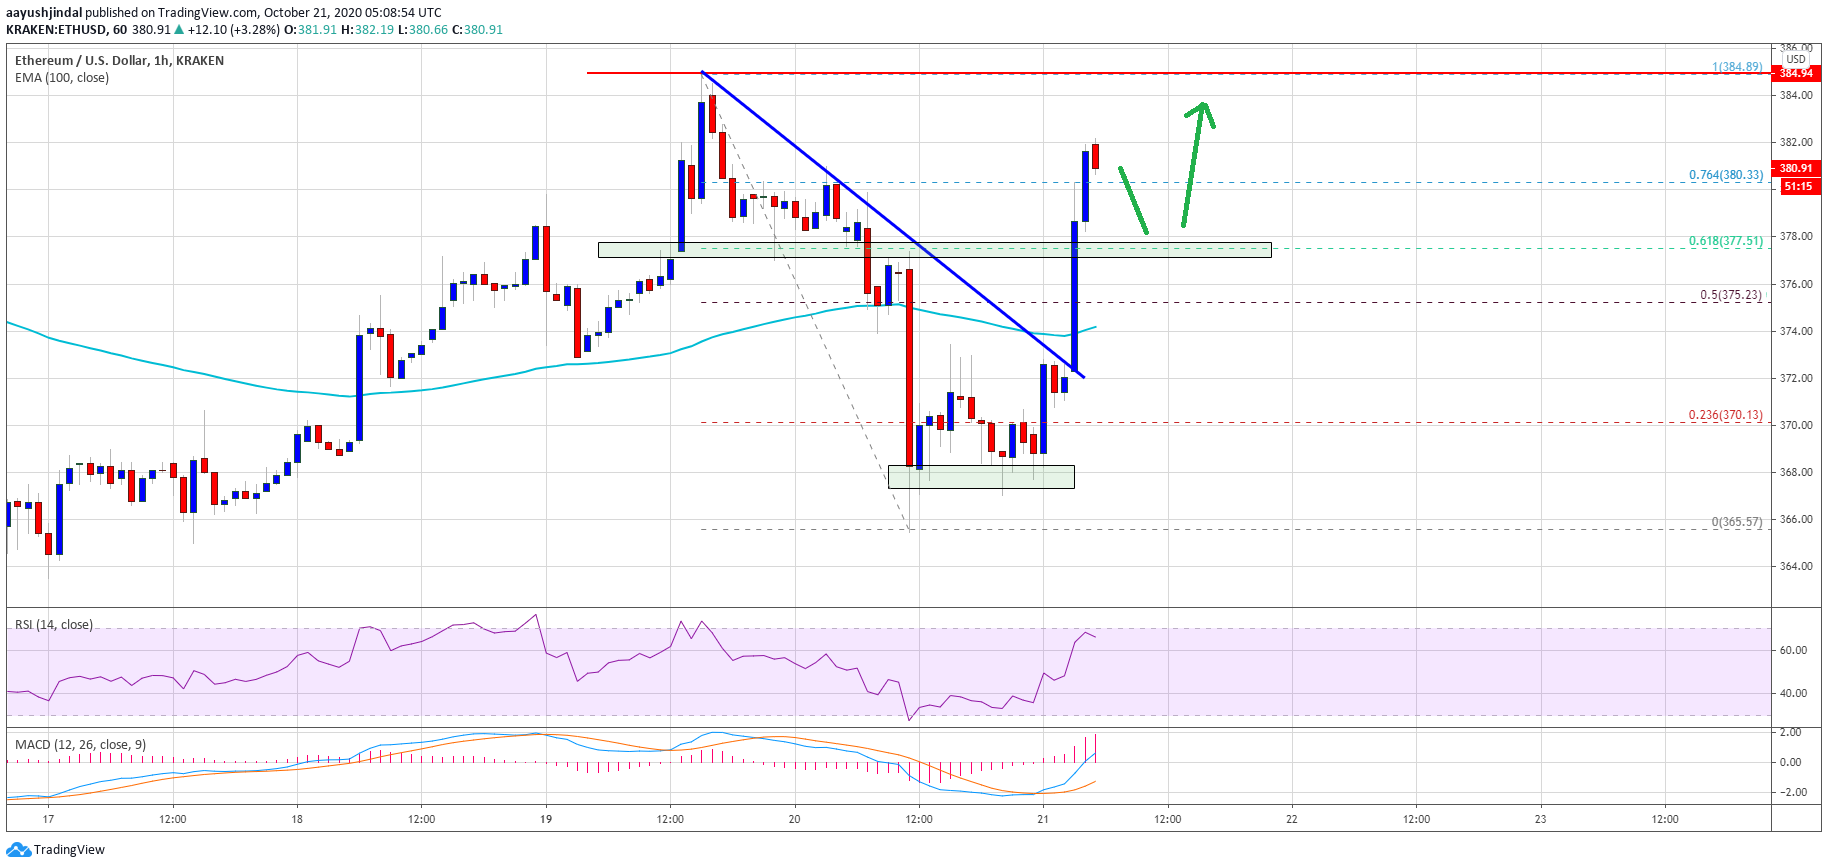
Ethereum is gaining bullish momentum above $375 against the US Dollar. ETH price is showing positive signs and it might even climb above the $385 resistance. Ethereum started a fresh upward move after forming a support base near $368. The price is now trading well above the $375 level and the 100 hourly simple moving […]
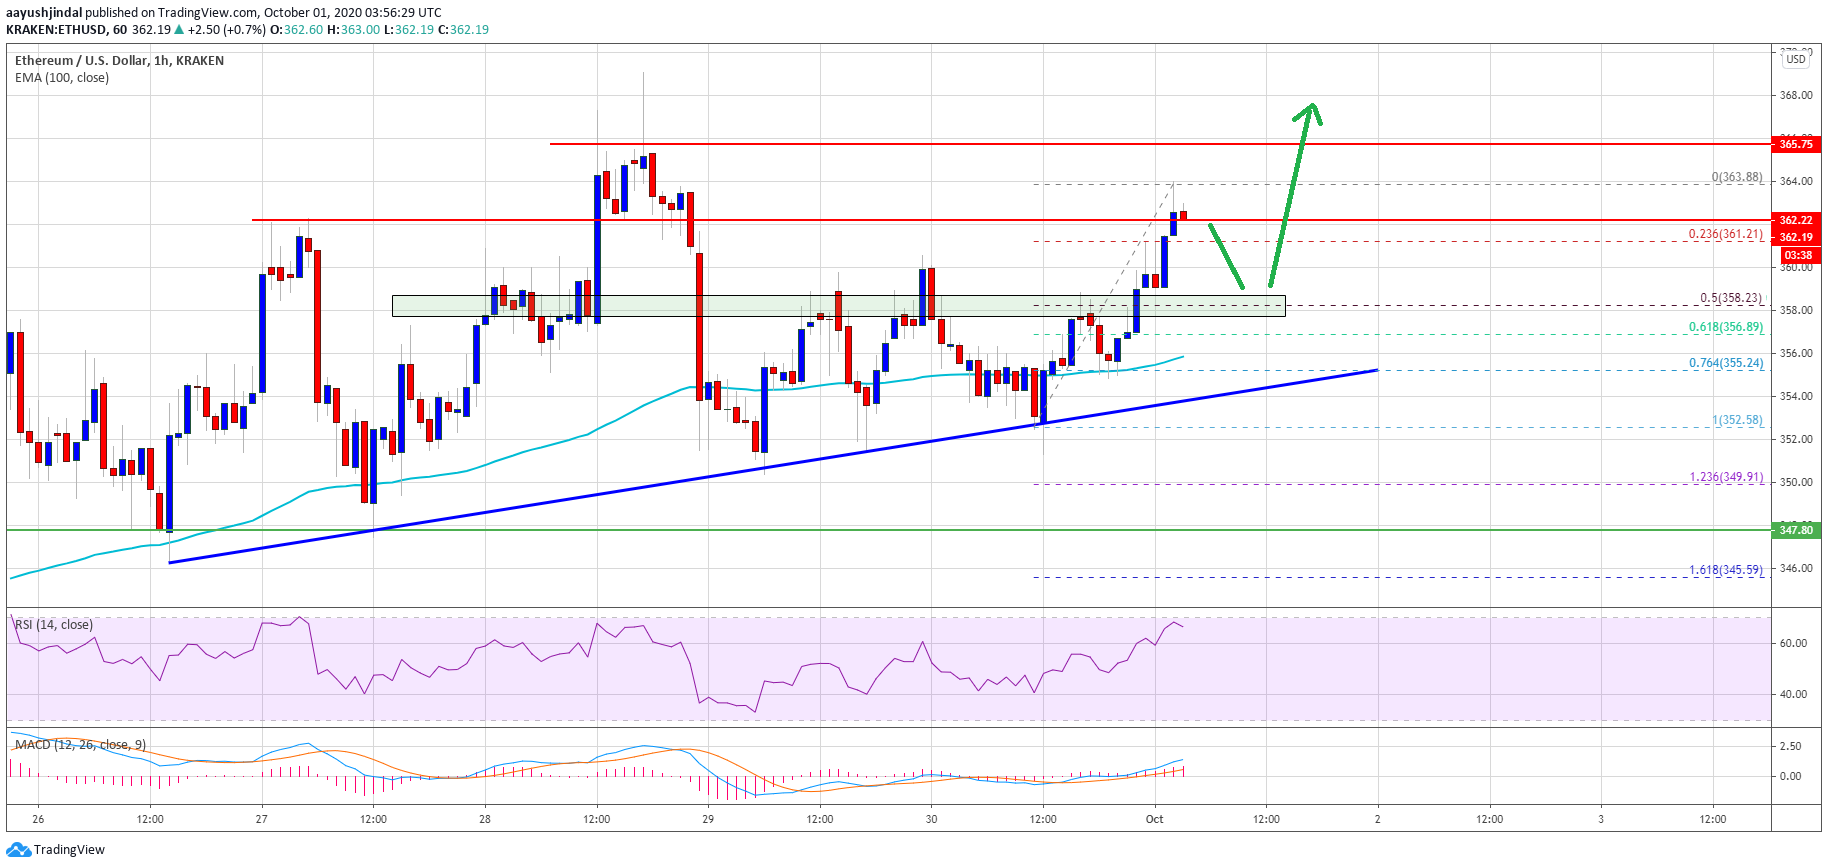
Ethereum is showing positive signs above the key $355 support against the US Dollar. ETH price could accelerate higher if it clears the $365 resistance zone. Ethereum is slowly rising and it is now trading well above the $355 support. The price is currently testing the $362 resistance and is above the 100 hourly simple […]
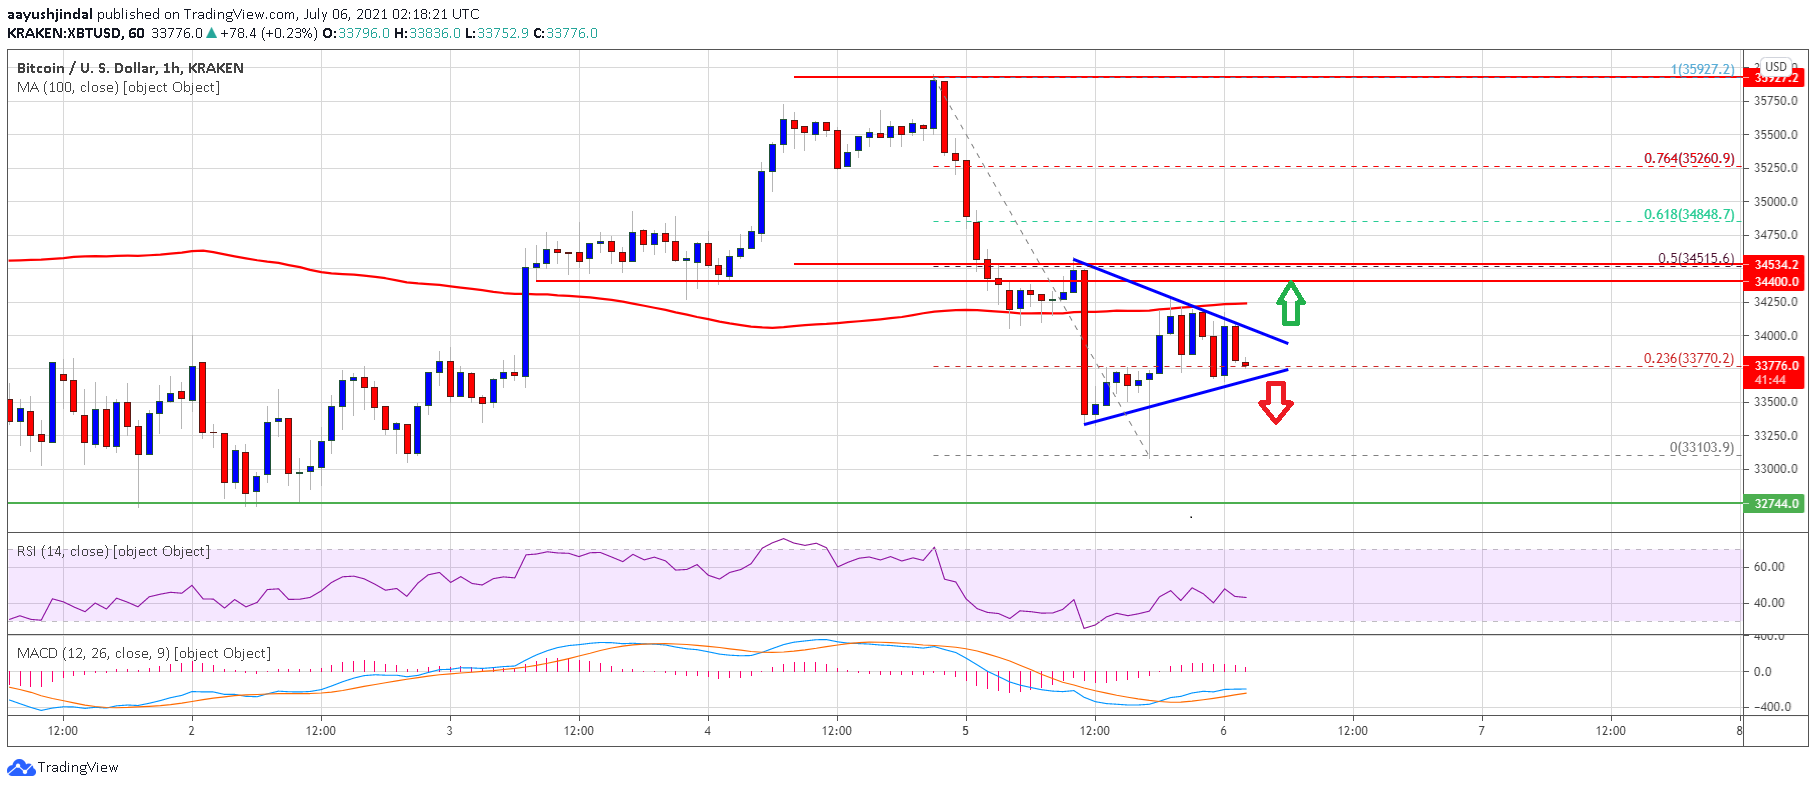
Bitcoin price is correcting gains and it is trading well below $35,000 against the US Dollar. BTC could decline further if it stays below $34,400. Bitcoin started a downside correction below the $35,000 and $34,000 levels. The price is now trading below the $34,000 support and the 100 hourly simple moving average. There is a […]

Ethereum Price Key Highlights. Upon breaking below the bottom of the rising wedge consolidation pattern recently, ethereum price has its sights set on new lows. Technical indicators suggest that the selloff is gaining traction but that a pullback to the broken support zones might still be possible. Ethereum price is eyeing further downside and might be ready to test the yearly lows as seen on the 4-hour time frame. Bearish Pressure Rising. Bitcoin price has broken to the upside of its consolidation pattern, which may have been partly to blame for the downside break in ETHXBT. The chart....