
TA: Bitcoin Resumes Decline, Indicators Suggest Limited Upside
Bitcoin started a fresh decline below the $50,000 support against the US Dollar. BTC remains at a risk of a larger decline below $47,500 in the near term. Bitcoin started a fresh decline below the $50,000 and $49,500 support levels. The price is trading below $49,000 and the 100 hourly simple moving average. There was a break below a bearish continuation pattern with support near $49,200 on the hourly chart of the BTC/USD pair (data feed from Kraken). The pair could correct higher, but upsides might be limited above $49,200 in the near term. Bitcoin Price Gains Bearish Momentum Bitcoin....
Related News
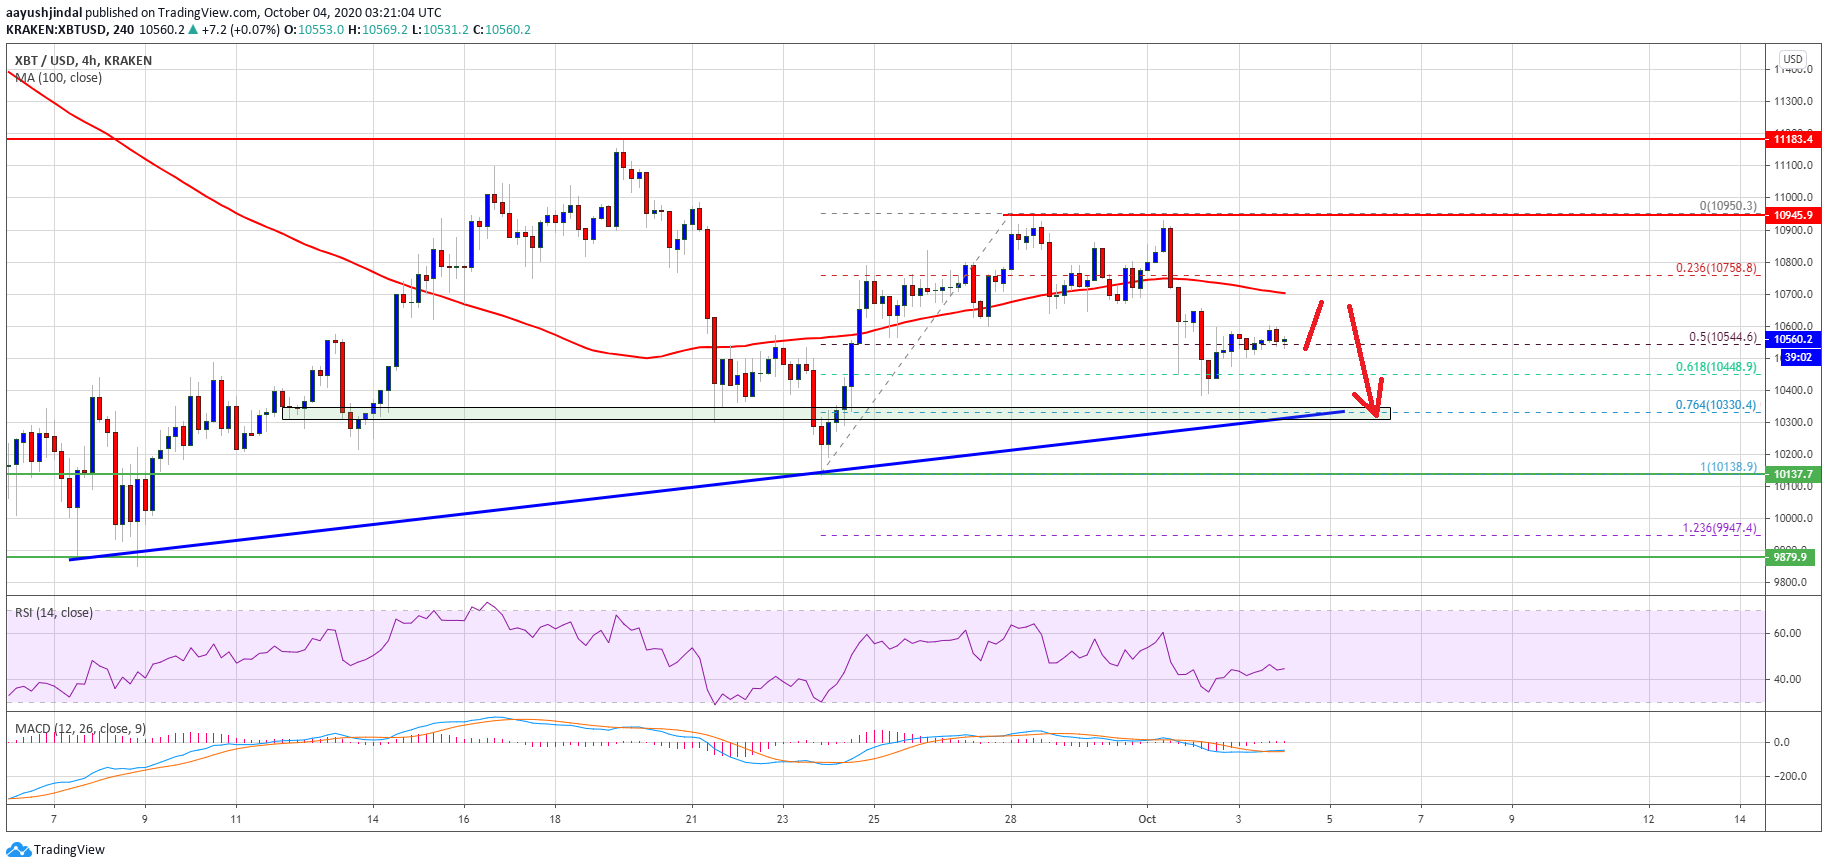
Bitcoin failed to surpass the $11,000 resistance and started a fresh decline against the US Dollar. BTC is now well below the 100 SMA (H4) and it could decline further towards $10,000. Bitcoin failed once again to clear the $10,950 and $11,000 resistance levels. The price is now trading well below $10,750 and the 100 […]

Bitcoin price action has, during the past 24-hours, seen a lower low (for decline since 21 August) established across most exchanges. Although indicators are stretched to the max, additional downside is on the cards. Analysis, below, considers the options. Bitcoin Wave Structure Recount. The Bitstamp chart below shows the lower low established during trade today. This has occurred across all exchanges, and unless price turns up from current levels, we will be best-prepared to anticipate eventual decline to $412. The wave count has been adjusted to accommodate the new low and make provision....

Cardano’s price started a fresh decline below $0.280. ADA is struggling and key indicators suggest high chances of more downsides below $0.252. ADA price is gaining bearish momentum below the $0.285 level against the US dollar. The price is trading above $0.280 and the 100 simple moving average (4 hours). There is a major bearish trend line forming with resistance near $0.274 on the 4-hour chart of the ADA/USD pair (data source from Kraken). The pair could start a recovery wave if there is a close above the $0.280 resistance. Cardano’s ADA Price Faces Uphill Task In the past few days,....
XRP price started a fresh decline below the $2.920 zone. The price is now showing bearish signs and might decline again below the $2.80 zone. XRP price is moving lower below the $2.920 support zone. The price is now trading below $2.90 and the 100-hourly Simple Moving Average. There is a bearish trend line forming with resistance at $2.920 on the hourly chart of the XRP/USD pair (data source from Kraken). The pair could continue to move down if it dips below $2.80. XRP Price Declines Sharply XRP price failed to extend gains above $3.120 and started a fresh decline, like Bitcoin and....
Ethereum started a fresh decline after it faced rejection near $3,300 against the US Dollar. ETH price could extend decline towards $3,000 in the near term. Ethereum started a fresh decline after it faced rejection near $3,280 and $3,300. The price is now trading below $3,220 and the 100 hourly simple moving average. There is a major bearish trend line forming with resistance near $3,320 on the hourly chart of ETH/USD (data feed via Kraken). The pair could extend decline to $3,000 if it trades below the $3,150 support. Ethereum Price Resumes Decline Ethereum attempted an upside correction....