
TA: Bitcoin Eyes Steady Recovery, Why Bulls Might Struggle
Bitcoin started a recovery wave above $36,000 against the US Dollar. BTC must settle above the $38,000 zone to start a steady upward move. Bitcoin is trying to clear the $37,500 and $38,000 resistance levels. The price is now trading above $36,500 and the 100 hourly simple moving average. There is a key breakout pattern forming with resistance near $37,500 on the hourly chart of the BTC/USD pair (data feed from Kraken). The pair could start a steady upward move if there is a clear move above the $38,000 resistance. Bitcoin Price Eyes Upside Continuation Bitcoin price managed to stay above....
Related News

Ethereum price started a recovery wave and surged above $3,000. ETH might continue to rise if it clears the $3,080 resistance. Ethereum started a recovery wave above $2,980 and $3,000. The price is trading above $2,960 and the 100-hourly Simple Moving Average. There is a key bullish trend line forming with support at $2,950 on the hourly chart of ETH/USD (data feed via Kraken). The pair could continue to move up if it settles above the $3,080 zone. Ethereum Price Eyes More Gains Ethereum price managed to stay above $2,880 and started a recovery wave, like Bitcoin. ETH price was able to....
Solana found support at $85 and corrected some losses. SOL price is now consolidating above $90 and might aim for a steady increase. SOL price started a decent recovery wave above $88 and $90 against the US Dollar. The price is now trading above $90 and the 100-hourly simple moving average. There was a break above a key bearish trend line with resistance at $88 on the hourly chart of the SOL/USD pair (data source from Kraken). The price could continue to move up if it clears $92.80 and $95. Solana Price Eyes Recovery Solana price remained stable and started a decent recovery wave from $85,....
Ethereum price started a recovery wave above the $2,110 zone. ETH is now consolidating and might struggle to continue higher above the $2,150 resistance. Ethereum started a recovery wave above the $2,120 zone. The price is trading below $2,140 and the 100-hourly Simple Moving Average. There was a break above a bearish trend line with resistance at $2,110 on the hourly chart of ETH/USD (data feed via Kraken). The pair could start a fresh decline if it stays below the $2,150 zone. Ethereum Price Eyes Recovery Ethereum price remained bid above the $2,065 support zone, like Bitcoin. ETH price....
Ethereum (ETH) is once again trading above the $2,000 mark after several days of struggle, offering a glimmer of hope for investors looking for a recovery. The second-largest cryptocurrency has faced intense selling pressure in recent weeks, losing over 38% of its value since late February. Panic spread through the market when ETH broke below the key $2,000 level and later plunged under $1,800 — a move that signaled weakness and raised fears of a deeper correction. Related Reading: Dogecoin Breaks Above Bullish Daily Pattern – Analyst Sees A Surge To $0.43 Despite the volatility, market....
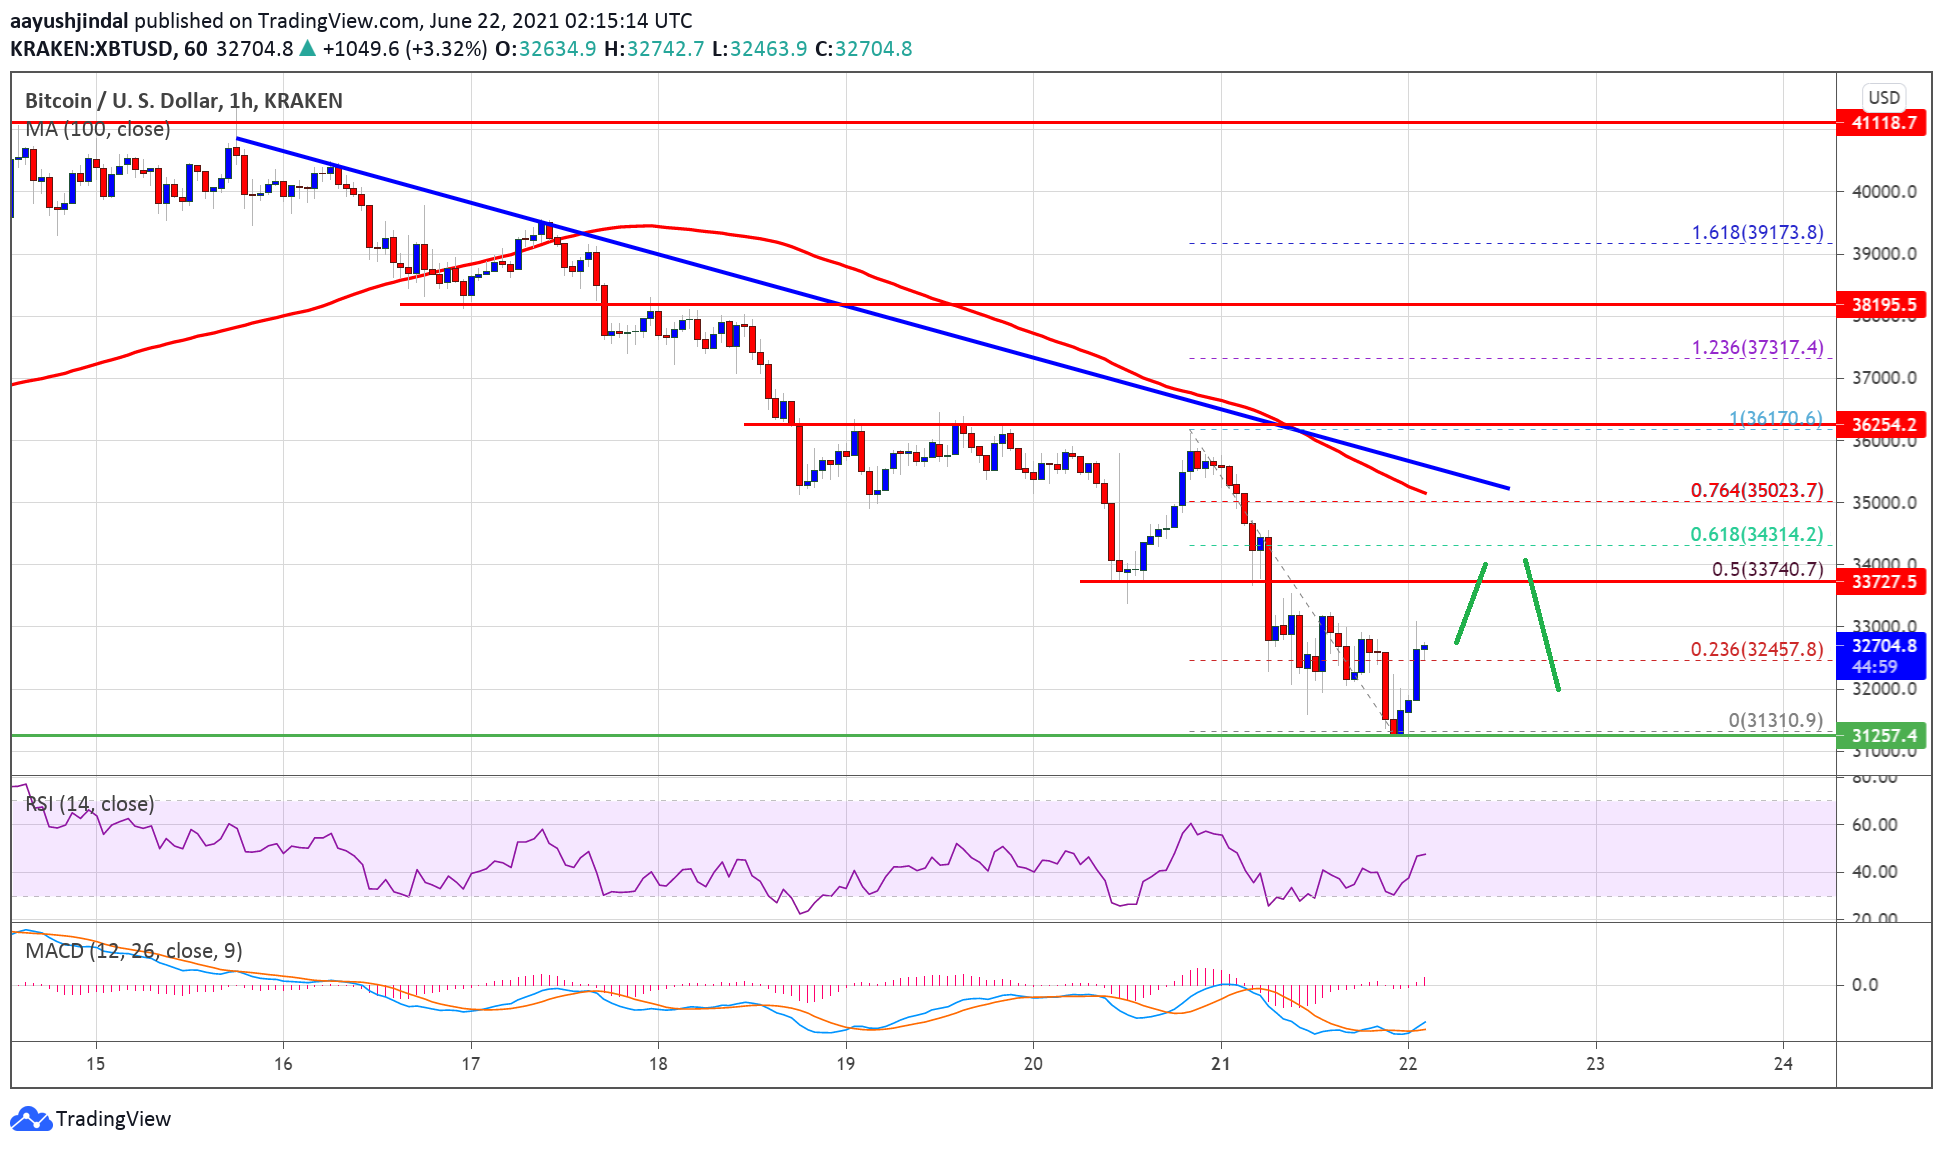
Bitcoin price extended its decline and tested the $31,500 zone against the US Dollar. BTC is now recovering losses, but it is likely to face sellers near $34,000 and $35,000. Bitcoin remained in a bearish zone and it even broke the $32,000 support zone. The price is now trading well below $35,000 and the 100 […]