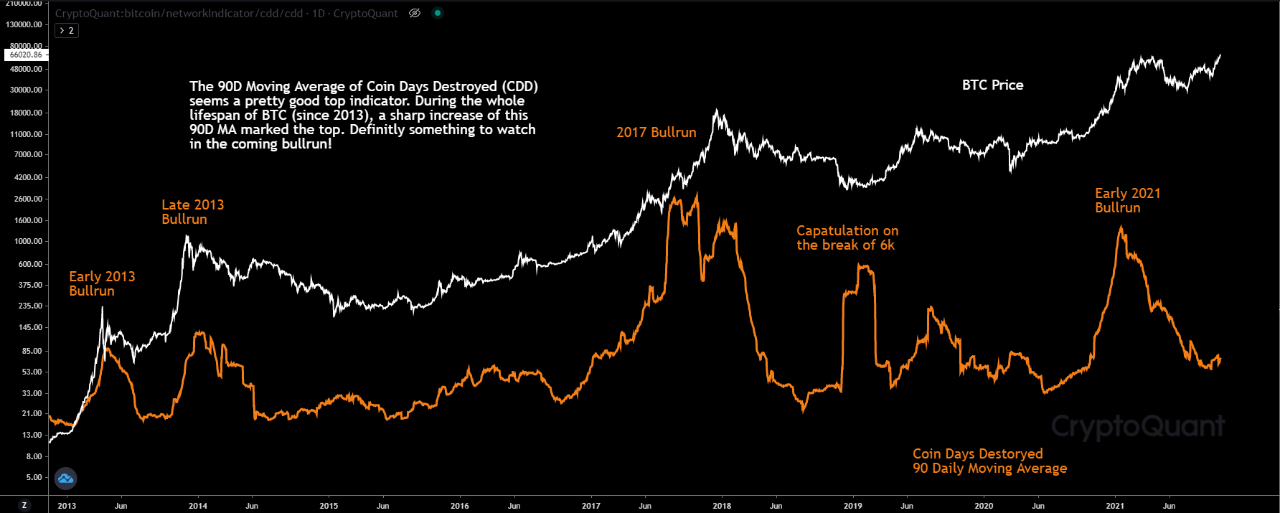
Can “Coin Days Destroyed” Indicator Predict Bitcoin Tops?
Historical data of the “coin days destroyed” indicator versus the Bitcoin price may suggest the metric can help predict tops. The Bitcoin Coin Days Destroyed (CDD) Indicator As explained by an analyst in a CryptoQuant post, the coin days destroyed metric might be a reliable indicator for BTC tops. A “coin day” is defined as […]
Related News

Quant explains how there may be a correlation between the Gemini Bitcoin netflow and BTC price tops, based on pattern of the last few years. Can Gemini Netflow Predict Bitcoin’s Price Tops? As posted by an analyst on CryptoQuant, the historical chart for the Gemini netflow (30-day MA) vs the price reveals there could be a correlation between the indicator and BTC tops. The Bitcoin netflow here refers to the net number of coins exiting or entering the crypto exchange Gemini. The indicator’s value is simply calculated by taking the difference between the inflows and the outflows.....
There are many different indicators that analysts have used to predict the Bitcoin bottom in the past, and the Cumulative Value Days Destroyed (CVDD) is one of them. Mostly, these indicators are known for predicting the bottom because when they have appeared in the past, it did not take long until the Bitcoin price reached the lowest level of the cycle. The interesting thing about the CVDD flashing now is how low it is putting the BTC price before it finds a bottom. CVDD Says Bitcoin Price Is Going Lower The Cumulative Value Days Destroyed (CVDD) was highlighted by crypto analyst....
A quant breaks down how the Bitcoin NUPL indicator may be able to predict the beginning of a new bull run based on past pattern. How The Bitcoin NUPL Metric May Predict The Start Of Bull Run As explained by an analyst in a CryptoQuant post, the various phases of the NUPL indicator may shed some light relating to the bull run status for BTC. The net unrealized profit and loss (or NUPL in short) is a metric that’s defined as the difference between the market cap and the realized cap, divided by the market cap. NUPL = (Market Cap – Realized Cap) ÷ Market Cap In simpler terms, what....
The Bitcoin bear market is now six months in and showing no signs of letting up. During this time, a cycle low of $60,000 was established, preceding the present consolidation action being seen. However, bearish sentiments remain at heightened levels, especially considering the disturbed geopolitical landscape of the past month. While there have been encouraging signs of ongoing institutional accumulation, there are still expectations of a market bottom, which would confirm a bullish trend reversal. Related Reading: Bitcoin Price Breakdown To $45,000: The Levels To Watch Out For Next Steps....

Elliott Waves are a popular yet controversial technical analysis indicator. This post will explore the relevance of Elliott Waves for bitcoin trends. Elliott Waves are a technical analysis indicator to predict future price trends. The principles of Elliott Waves are founded on the belief that markets follow predictable sequences of optimism and pessimism. The sequence of a bull market follows the below pattern. A bear market follows an exact opposite sequence. To learn how to apply Elliott Waves,watch this tutorial by DanV, a very popular Trading View bitcoin chartist.