4 metrics suggest Bitcoin price will correct — But can BTC hit $20K first?
Several key metrics hint at a Bitcoin price pullback, but this may be offset by other conflicting factors. A pullback in the price of Bitcoin (BTC) is likely, based on several on-chain data points, namely the Spent Output Profit Ratio (SOPR) indicator, stablecoin inflows, stacked sell orders at $19,000, and the Crypto and Fear Index. However, the question remains when that correction would occur.Profit-taking pullback possible with lower buy pressureThe SOPR indicator essentially gauges how profitable Bitcoin holders are at the moment. When the SOPR is high, BTC is at risk of a....
Related News
Another price dip is required before continuation, one trader says, giving a short-term target of $36,000 for BTC/USD. BItcoin (BTC) edged closer to $40,000 on June 3 as bulls gathered increasing signals that the bottom is in.BTC/USD 1-hour candle chart (Bitstamp). Source: TradingViewBTC/USD to $36,000 next?Data from Cointelegraph Markets Pro and TradingView showed BTC/USD retaining levels it reclaimed a day before, including the critical $37,500.Now, eyes were on the coming days for confirmation of a breakout or rejection — volatility was already forecast to enter by the weekend.For....
Bitcoin remains on an upward trend after breaking through $40,000 once again. However, this upward trend has not translated onto on-chain metrics. While the price of the digital asset continues to sit in the green, on-chain metrics have plummeted paining an entirely different picture in relation to price. From miner revenues to transaction fees, the […]
Numerous on-chain indicators suggest Ethereum price is on the verge of another 2017-style bull run. Ether (ETH) price is currently ranging between $440 and $470, which is similar to the price action seen in December 2017. Back then, the scenario ended up being incredibly bullish, and the altcoin quickly rocketed toward $1,400. Fast forward to 2020, and some investors believe a similar outcome may occur as a few key on-chain and technical indicators are mirroring the levels seen in the previous bull run.On Dec. 10 Ether price was $450, and it took only 34 days for Ether to reach its....
The bear market is far from over, but according to Glassnode, several metrics suggest that Bitcoin capitulation already occurred. “When will it end?” is the question that is on the mind of investors who have endured the current crypto winter and witnessed the demise of multiple protocols and investment funds over the past few months.This week, Bitcoin (BTC) once again finds itself testing resistance at its 200-week moving average and the real challenge is whether it can push higher in the face of multiple headwinds or if the price will trend down back into the range it has been trapped in....
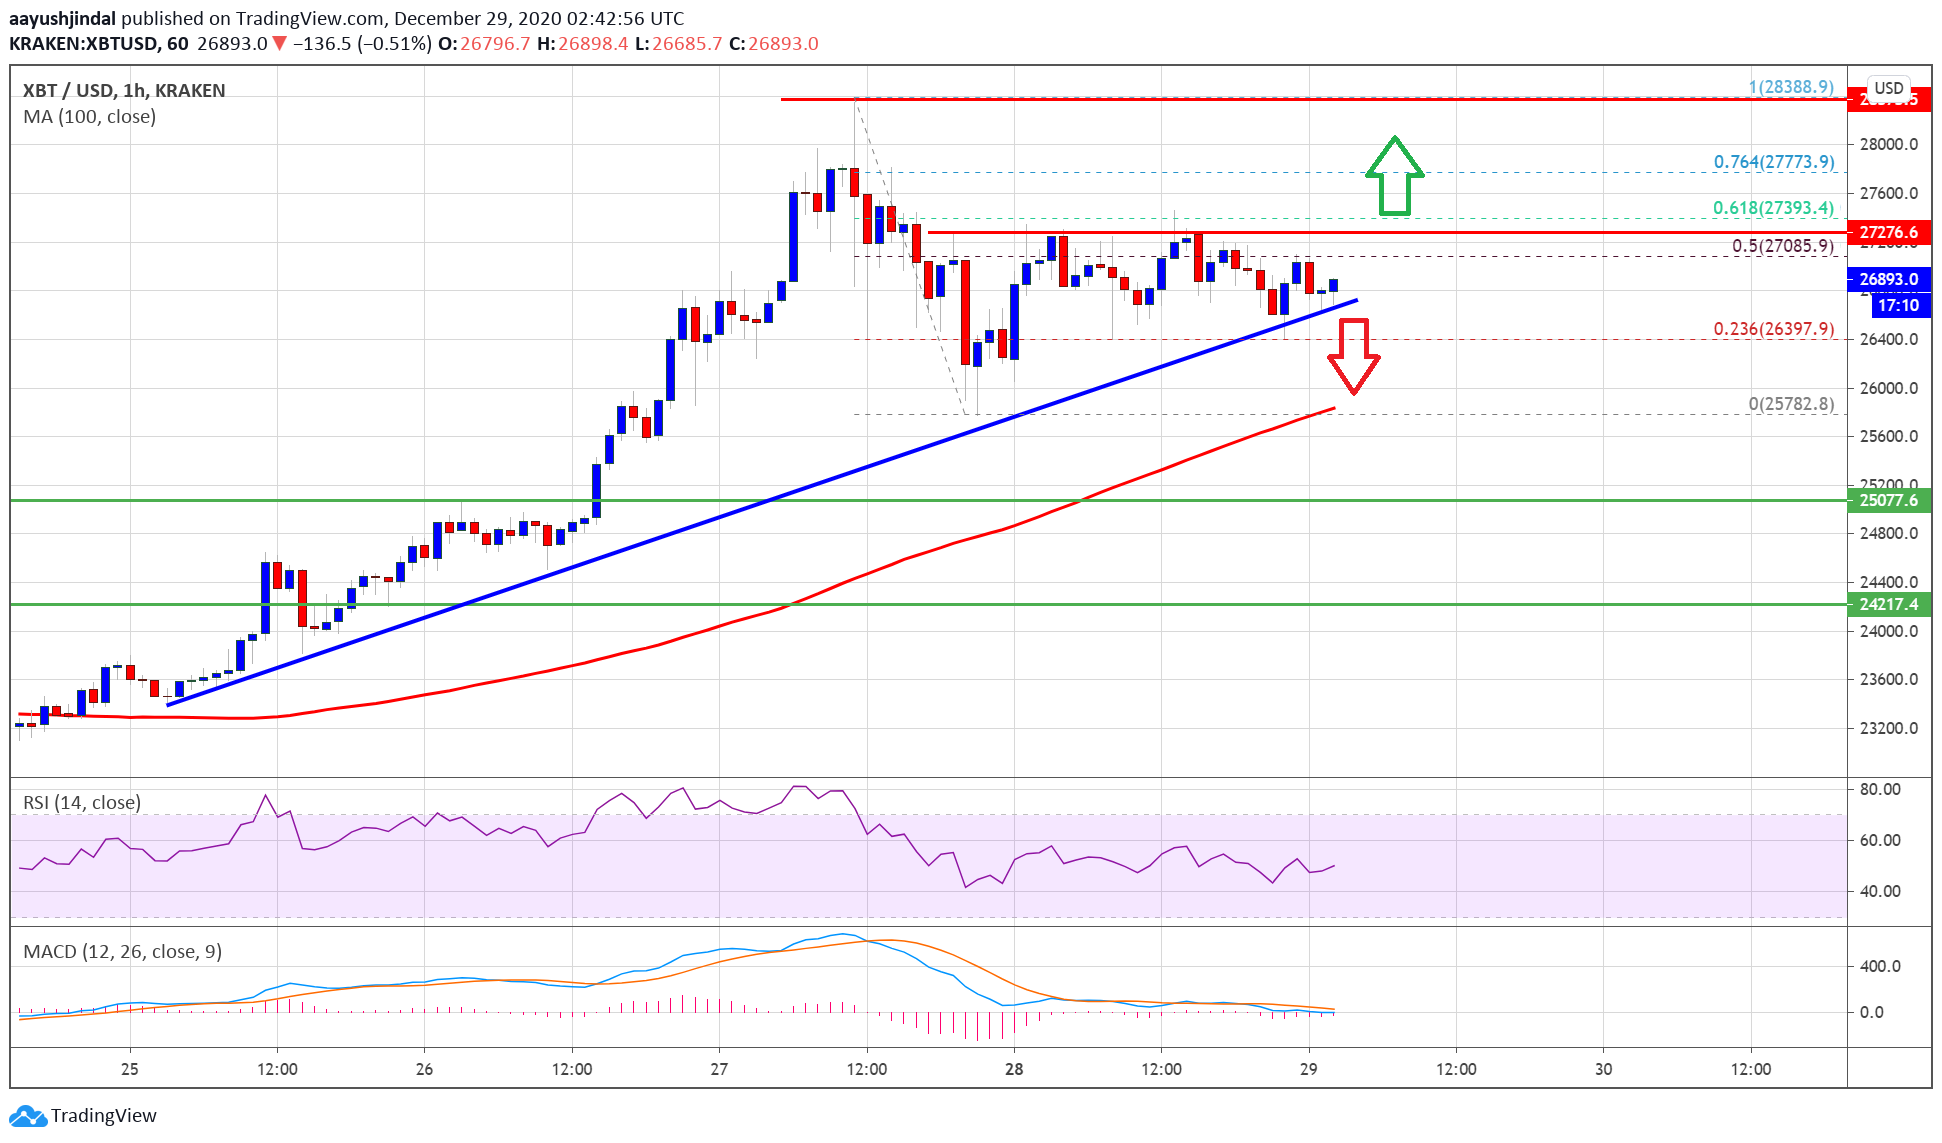
Bitcoin price is facing a strong resistance near the $27,300 area against the US Dollar. BTC could correct lower towards $26,000 or $25,500 in the near term. Bitcoin seems to be struggling to gain bullish momentum above the $27,300 barrier. The price is currently trading above the $26,500 support and the 100 hourly simple moving […]


