
Here’s The Best Time To Buy Bitcoin As Impulse Wave Sets Path To $150,000
With the latest rally to a new all-time high above $125,700, the Bitcoin price looks to have begun another path that could lead to multiple new all-time highs. At this time, market sentiment has moved back into the positive, and this continues to show in the way the price has held above $120,000 despite the corrective dips. Crypto analyst CrediBULL Crypto believes that this means that the Bitcoin price is set on its path to $150,000, so this report takes a look at the breakdown. Why The Bitcoin Price Is Headed To $150,000 And The Best Time To Buy In the analysis that was shared with over....
Related News

XRP is gearing up for a surge to $120, according to popular crypto analyst EGRAG CRYPTO. Taking to social media platform X, the analyst shared a fresh chart detailing a bullish outlook for XRP, suggesting that the cryptocurrency is retracing a path similar to its explosive 2017 rally. This time, however, the trajectory could be even more dramatic, as the chart accompanying his post outlines a long-term Elliott Wave formation that points first to $27 and eventually to a staggering $120 price tag. Echoes of 2017: XRP Retracing Cycle That Took Price To All-Time High The 2017 bull cycle is....

Yesterday, Bitcoin experienced a major breakout through $12,000 and in a flash was trading above $13,000. Buying on exchanges is picking up, which is, in turn, driving up prices. However, a “massive” wave of OTC buying suddenly could also be contributing to the bullish impulse. Here’s how. Bulls Push BTC To New 2020 High, Is […]
Crypto analyst PlanB has explained why the Bitcoin price may never drop below $100,000 again. This comes as market participants continue to speculate on whether the flagship crypto could fall below this psychological level if a full-blown bear market were to occur. Bitcoin Price Has Likely Turned $100,000 Into Support PlanB stated in an X post that he will not be surprised if the Bitcoin price does not drop below $100,000 again as the market witnesses the $100,000 resistance turn into $100,000 support. The analyst further noted that the September close was the fifth consecutive monthly....
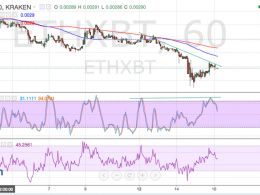
Key Highlights. Ethereum price is still in the middle of a correction from its previous selloff, but technical signals are indicating that the downtrend is set to resume soon. A bearish divergence can be seen, as the pair formed lower highs while stochastic made slightly higher highs. Ethereum price could fall from the current resistance levels back down to the previous lows at 0.00190BTC if selling pressure picks up. Impulse wave to resume. A higher pullback to the 0.00240BTC area near the 100 SMA and the previous support might still be possible if the correction wave isn't over. However,....
Bitcoin has shown renewed strength on the weekly timeframe by resuming a steady uptrend that began earlier in the year. After several weeks of ranging between $110,000 and $120,000, Bitcoin is now on intense momentum supported by institutional demand, which has led to a new all-time high in the past 24 hours. Interestingly, technical analysis of Bitcoin’s weekly price chart shows the cryptocurrency is gearing up for an explosion to $200,000. This projection is based on Bitcoin’s ongoing price behavior being an exact replica of Gold’s rally during the 1970s. Bitcoin Aligning With the....