Polkadot On A Bullish Run, Is This Price Level The New Target?
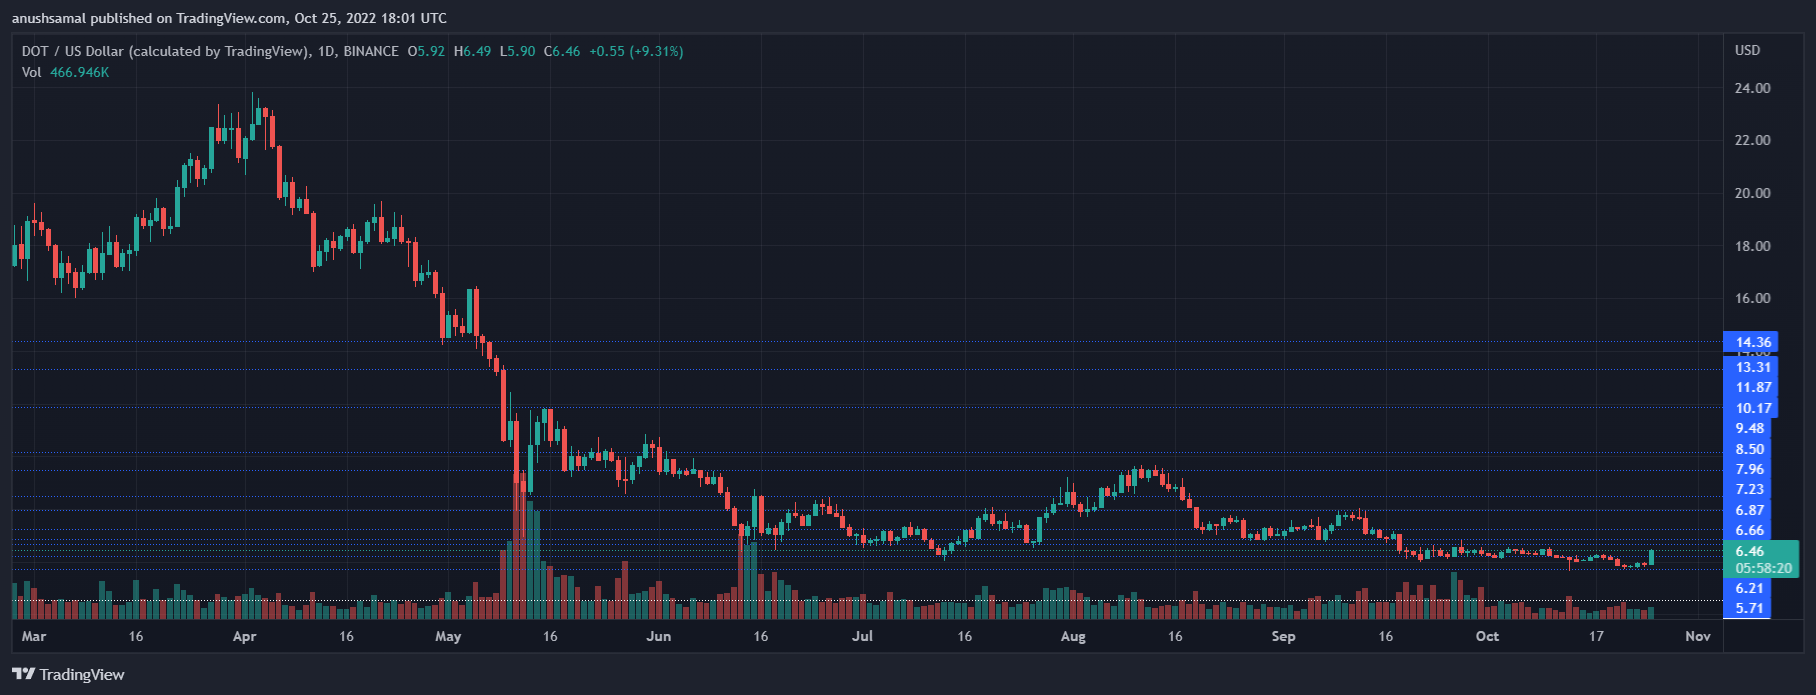
Polkadot price has registered a bullish revival on their 24-hour chart. Over the past day, DOT logged double-digit gains. In the past week, the altcoin has lost close to 3% of its market value. The major market movers have turned optimistic today, and most altcoins have followed suit. The technical indicator of Polkadot has registered bullish signals on the one-day chart. The demand for the altcoin has increased, which has made the coin register more buyers on the chart. The coin has to continue cruising up to move past the immediate resistance level. The move past the immediate resistance....
Related News

Polkadot ($DOT) is leading the charge as one of the few altcoins defying the bearish trend currently taking over the crypto industry. Despite market volatility, Polkadot has managed to hold strong above the $4.8 support level, with a bullish uptick of around +10% in the last week. This has investors buzzing with optimism as bulls […]

The bullish outlook appears as Polkadot prepares to auction highly anticipated parachain slots on its network. Polkadot (DOT) looks poised to rally toward $100 in the coming sessions as it triggers a classic bullish reversal setup.Dubbed Inverse Head and Shoulders (IH&S), the technical structure appears when an instrument forms three troughs in a row, with the middle one, called the Head, being the lowest, and the other two — known as the right and left shoulders — of almost equal heights. Meanwhile, the level at which all the troughs top out represents the "neckline."So it appears DOT has....
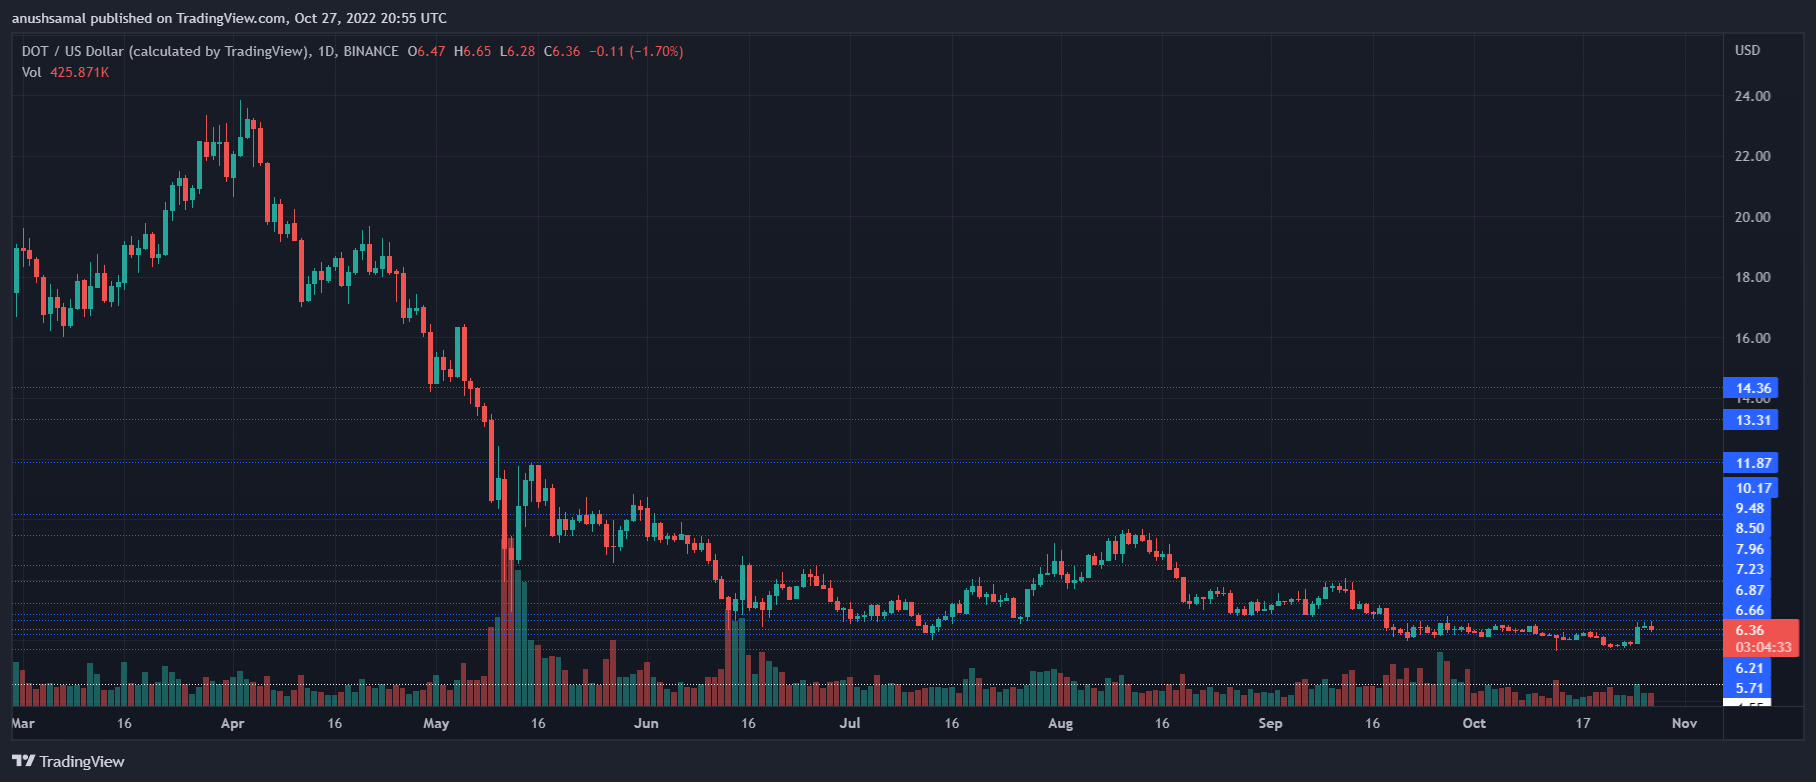
Polkadot price has retraced on its chart over the last 24 hours. The coin has started to register sideways movement on its one-day chart. During this period, the coin lost close to 2% of its market value. In the last week, DOT registered more than 6% appreciation, which caused the bulls to gain stamina and break past the consolidation phase. The technical outlook for the coin remained positive; however, the indicators indicated that the bullish momentum was fading off the charts. Bitcoin also retraced slightly on its chart. Many altcoins have also started to trade sideways following....

Polkadot has witnessed continued downfall in price since the last month. It has now established its support level at $6.30, however, the coin has been trading very close to that support level. After it broke below the $6.66 support line, the coin has spiralled downwards. It retested the $6.30 level the past month. Technical outlook for the coin displayed build up of bullish pressure. The price of the altcoin has remained sandwiched between the $6.58 and $6.30 levels over the last trading sessions respectively. DOT has continued to face rejections at the $7 level and that had exhausted the....
Polkadot recovered on its chart, over the last 24 hours the coin surged over 4%. Over the past week, the altcoin did not register much price movement. The altcoin painted a bullish picture today with technical outlook pointing towards a change in price action. The coin regained its lost value quite a bit considering DOT flashed signs of revival. Polkadot has been breaking past resistance lines one after the other and at the moment the coin could aim at its overhead price ceiling. Price started to pick up momentum ever since it moved past the $9 price level. The aforementioned price level....