
XRP Ready For Bullish Pop As Important Technical Signal Reappears
XRP has defended support at $2.90 and made several attempts to push above $3.10 over the past week. Although XRP bulls have managed to hold above $3, the cryptocurrency hasn’t really followed rallies witnessed by Bitcoin and Ethereum in the past 24 hours. Nonethless, XRP’s price action in the past few days has caused its price chart to print a new technical setup that has previously marked the beginning of significant rallies, and history might repeat itself again. Related Reading: Bitcoin Breaks $123,000 As Rising Open Interest Signals More Action Ahead Bullish XRP Technical....
Related News

A crypto market expert has reported that Bitcoin (BTC) has just formed its most bullish signal amid the ongoing bear market trend. According to the analyst, this technical signal could be the catalyst for a major bullish turnaround, potentially propelling Bitcoin’s price to explosive levels. Analyst Reveals Bitcoin’s Most Bullish Signal Yet The Bitcoin price […]

It is a stretch to say Bitcoin is bullish, but what if bulls were simply resting after a tough “evening” and are just about ready for a new “morning?” A potential, high timeframe bullish Japanese candlestick reversal pattern called a morning star could be predicting just that. Here is a closer look at the potential reversal signal and the conditions necessary for confirmation of bullish upside. A “Morning Star” Could Jump Start A Bullish Reversal Bitcoin has been in a brutal downtrend since November 2021. After a full month of extreme fear in the crypto....
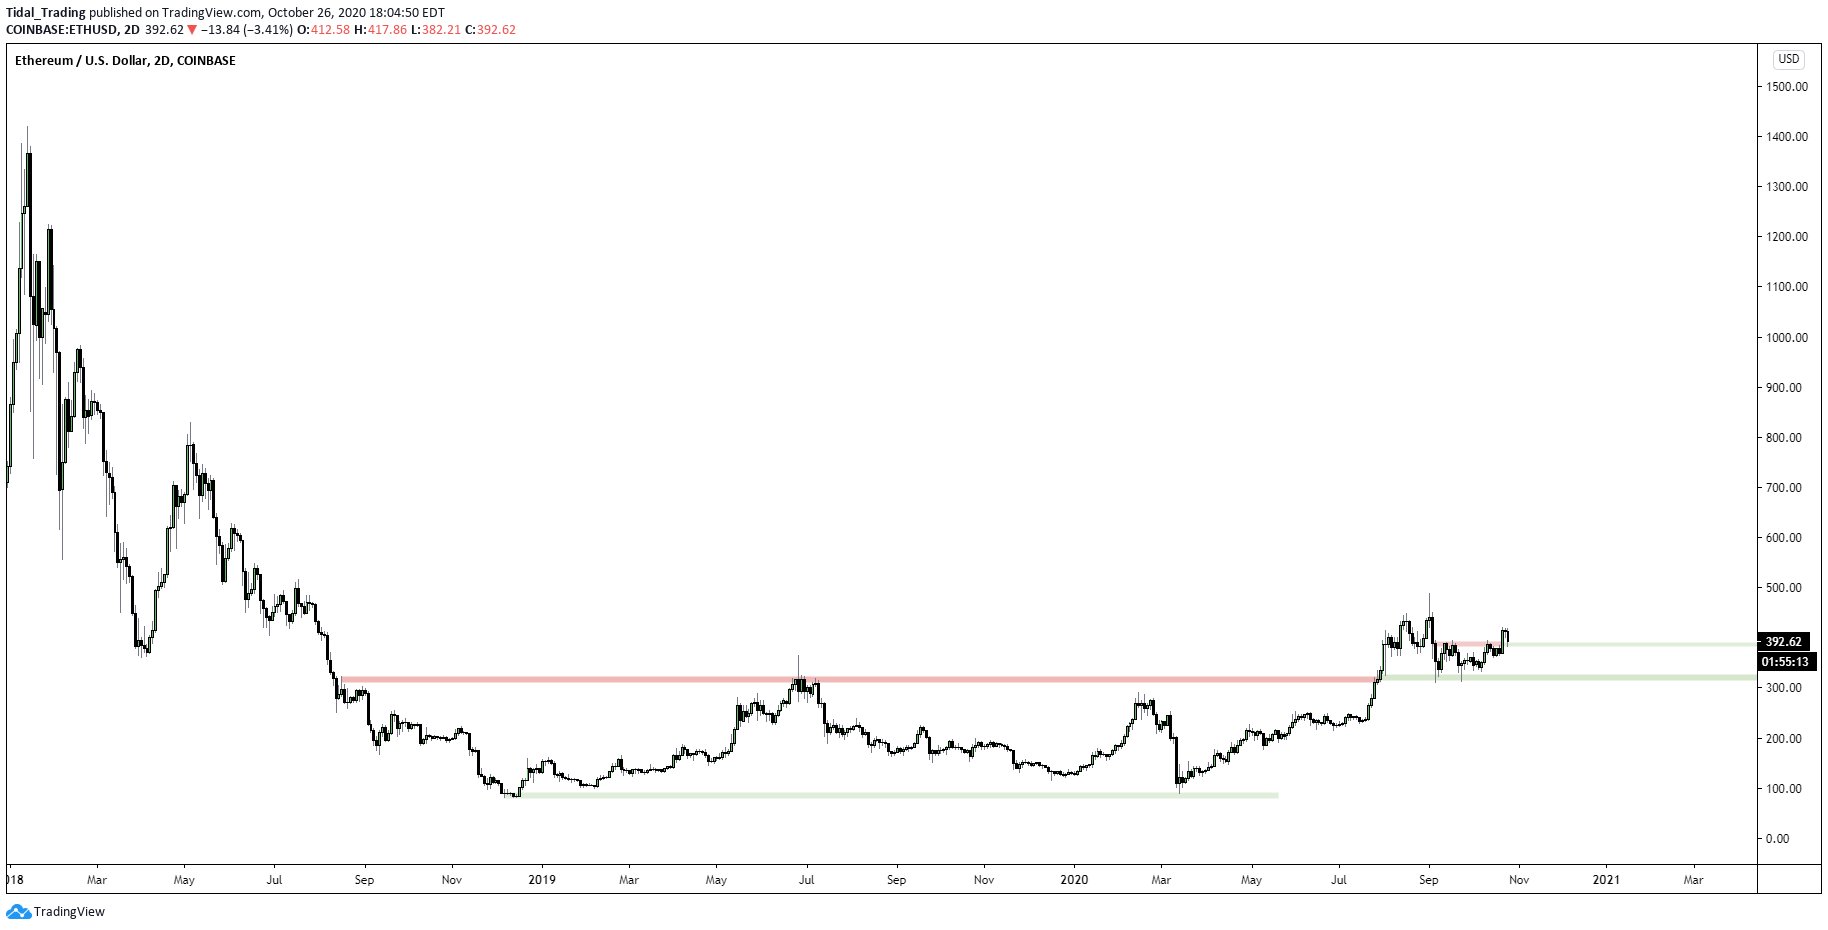
Ethereum is expected to move much higher in the months ahead as the leading cryptocurrency prints a bullish technical signal. Ethereum Bounces Cleanly Off $390 Horizontal Region in Bullish Move As the chart shared below shows, ETH recently bounced off the $380-390 horizontal region, which marks a win for bulls. The chart shows that over the past few months and even stretching into 2018, the high-$300s were an important level for Ethereum to hold. The […]
In the last few weeks, the sentiment around Bitcoin has turned around as bulls have pushed it past the $100,000 mark once again. Despite the recent drawdown, the BTC price is still bullish, with the market sentiment sitting in greed. However, a new development on the Bitcoin weekly chart could signal an end to the recent bullishness, just like it did back in 2022. Sell Signal From 2022 Reappears Back in 2022, large sell-offs triggered by the crash of the FTX crypto exchange brought an abrupt end to the Bitcoin bull market and plunged investors into months of despair as prices lagged.....

The Bitcoin 4-hour price chart is seeing a bullish divergence and a TD9 buy as hopes for a relief rally rise. The price of Bitcoin (BTC) has rebounded strongly from sub-$17,600 to $18,400 in the past 24 hours. Now, two major technical indicators are signaling the likelihood for a larger relief rally.The 4-hour price chart of Bitcoin is showing a bullish divergence just as it prints a TD9 buy signal. Both indicators typically light up when an asset sees a strong sell-off and the selling pressure gets exhausted.The Bitcoin sell-off might be losing steamThe 4-hour bullish divergence and TD9....