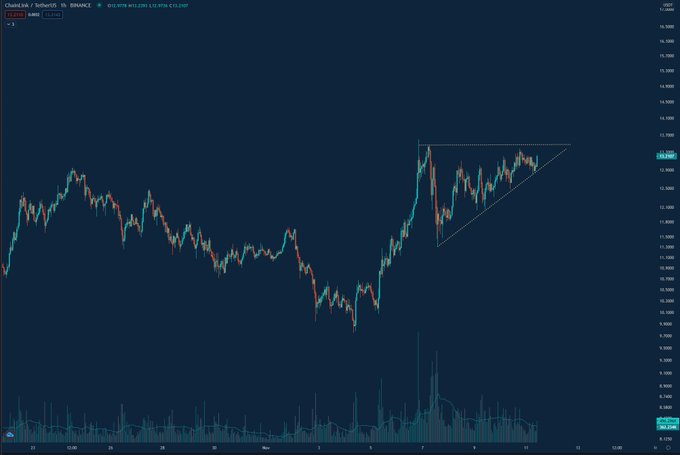
Chainlink Forms Crucial Ascending Triangle as Analysts Eye Move to $15
All eyes are on Chainlink (LINK) as the altcoin market resumes its recovery. The price of the leading cryptocurrency has gained 25% in the past week, reclaiming the $13 support as buyers have flooded back in. Chainlink is primed to move higher in the weeks ahead, analysts say. They cite positive fundamental trends and technical […]
Related News

An analyst has pointed out how Chainlink could see a major bullish breakout if its price can break past the resistance barrier of this technical analysis (TA) channel. Chainlink Is Currently Trading Inside A Triangle In a new post on X, analyst Ali Martinez has talked about a level that could trigger a major bull rally for Chainlink. The level in question is the upper line of a Triangle from TA. This pattern appears whenever an asset’s price trades between two converging trendlines. Like any other consolidation channel in TA, the upper line of a Triangle is a source of resistance and....
A cryptocurrency analyst has explained how a Chainlink triangle breakout setup could point to a massive $100 target for the asset’s price. Chainlink Is Coiling Inside A Triangle Right Now In a new post on X, analyst Ali Martinez has talked about a triangle pattern forming in the weekly price of Chainlink. Triangles refer to consolidation channels from technical analysis (TA) that involve an asset trading between two converging trendlines. Like any other consolidation channel, the upper trendline acts a source of resistance, while the lower one that of support. In other words, tops....
An analyst has pointed out how Chainlink could see its next major move after it breaks past the range of this technical analysis (TA) pattern. Chainlink Has Been Trading Inside A Triangle Recently In a new post on X, analyst Ali Martinez has shared about a pattern forming in the 1-week price of Chainlink. The pattern is a Triangle from TA, which is a type of consolidation channel that appears whenever an asset’s price trades between two converging trendlines. Related Reading: Bitcoin “Arguably Undervalued,” Says Analytics Firm: Here’s Why Like other consolidation patterns in TA, the....
Solana is currently breaking above an Ascending Triangle that could set a target of around $300, according to a cryptocurrency analyst. Solana Is Breaking Out Of An Ascending Triangle In a new post on X, analyst Ali Martinez has discussed about a triangle technical analysis (TA) pattern forming in the 12-hour price of Solana. The pattern in question is an “Ascending Triangle,” which appears whenever an asset’s price consolidates between two converging trendlines. Related Reading: Solana Social Media Hype Hits 11-Week High As Price Jumps 16% The special feature of the....
A cryptocurrency analyst has pointed out how the support level of a 9-year long pattern could provide the “ultimate” buy-the-dip opportunity for XRP. XRP Has Potentially Been Following A Long-Term Ascending Triangle In a new post on X, analyst Ali Martinez has shared a long-term pattern in the monthly price chart of XRP. The pattern in question is an “Ascending Triangle” from technical analysis (TA), which forms when an asset trades between two converging trendlines. A key feature of the Ascending Triangle that sets it apart from other triangle patterns is that its....