Bitcoin Price Takes a Sharp Dip: Is This Just a Correction?
Bitcoin price is correcting gains from the $73,500 zone. BTC is back below the $70,000 level and showing a few bearish signs. Bitcoin started a fresh decline from the $73,500 zone. The price is trading below $71,500 and the 100 hourly Simple moving average. There was a break below a key bullish trend line with support at $70,000 on the hourly chart of the BTC/USD pair (data feed from Kraken). The pair is showing a few bearish signs and might test the $68,500 support zone. Bitcoin Price Trims Gains Bitcoin price failed to trade to a new all-time and started a downside correction from the....
Related News
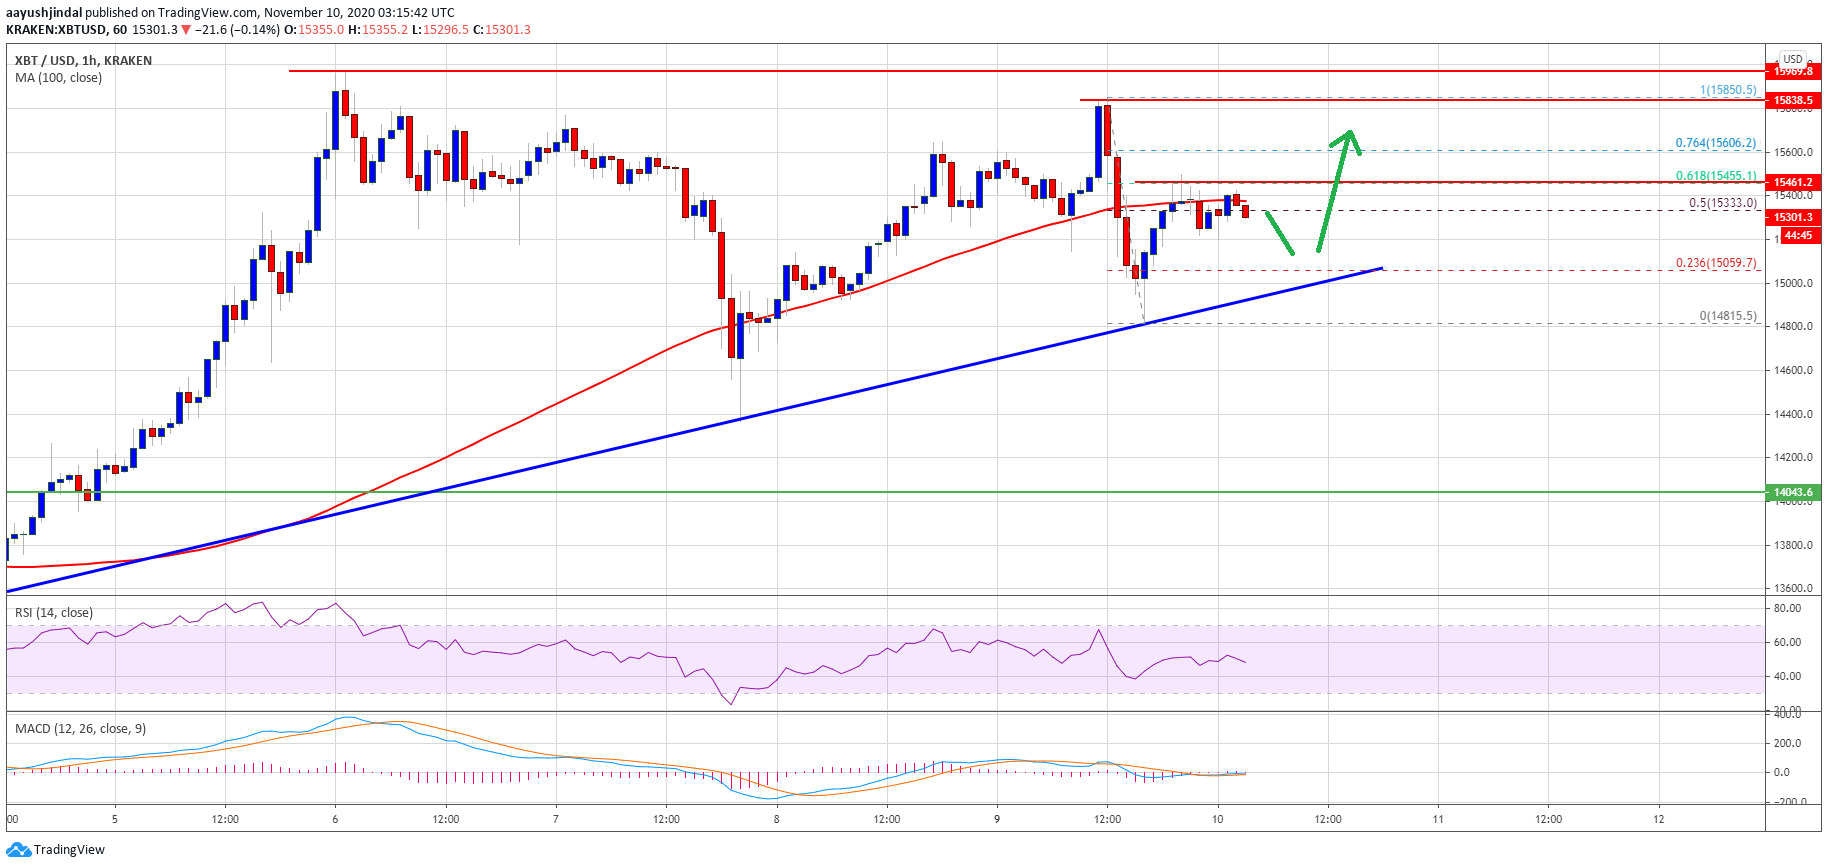
Bitcoin price is struggling to settle above $15,500 and $15,600 against the US Dollar. BTC is likely to start a sharp downside correction if it breaks the $15,000 support. Bitcoin is showing a few bearish signs below the $15,500 and $15,600 levels. The price is currently trading below $15,400 and the 100 hourly simple moving […]
Ethereum price is continuing to fall. It is currently traded at the long-term correction peak. Is there a way for the price to go up? USDTETH. Fall in demand. The fact that Ethereum price could settle at $300 just confirms the upward trend is weak. This mark is important for growth since it was the point of the biggest offer. It wasn’t able to uphold, so obviously the supply surpassed the demand. But at the moment, the fall in demand seems to be temporary. Sharp upward impulses after sharp fall only prove that. According to Vitalik Buterin, the Ethereum network development influences the....
Bitcoin has faced a significant correction, dropping 15% from its all-time high of $108,300. This price decline marks a sharp shift in market sentiment, which has quickly transitioned from an extremely bullish outlook to one of uncertainty and caution. As altcoins experience heavy losses, Bitcoin’s correction has raised concerns about the sustainability of the recent […]
Bitcoin price looks ready to make a correction from its recent rally, giving buyers a chance to hop in the uptrend at better levels. Bitcoin Price Key Highlights. Bitcoin price recently made a strong rally but it looks like bulls are booking profits. This could offer a nice opportunity to enter on a short-term correction from the sharp climb. Using the Fibonacci retracement tool on the latest swing low and high on the 1-hour time frame shows potential entry points. Technical Indicators Signals. The 100 SMA is above the longer-term 200 SMA so the path of least resistance is to the upside.....
Key Highlights. Litecoin price fell lower as anticipated in the weekly forecast and reached our sell trade target of $3.50. There was a sharp reversal noted from the mentioned area, as the price managed to recover all its losses. There is a chance of a double top pattern on the hourly chart around $3.83-85 (price feed from Bitfinex). Litecoin price after completing a correction started to trade higher once again, but it is facing a tough barrier near the last swing high of $3.85. Can Litecoin Price Move Lower? Litecoin price after setting a short-top near $3.83 moved lower as a part of....


