
Glassnode Report Shows Previous Bitcoin Surge Was A Bull Trap
In the past few days, some leading cryptocurrencies, such as Bitcoin and Ethereum, have shown a bullish price trend. Some link the reversal in value to the US President and the Fed’s recent outplay of events. However, Glassnode has a contrary opinion. The blockchain analytics firm believes that the fundamental change in price value is […]
Related News

Bitcoin price is on the rebound, but after such a sharp fall and more than 50% retracement, any reversal must be considered a potential bull trap until much higher prices are reclaimed. Further adding credence to the theory of a potential bull trap, a trend strength indicator very clearly shows that bears are in charge, […]
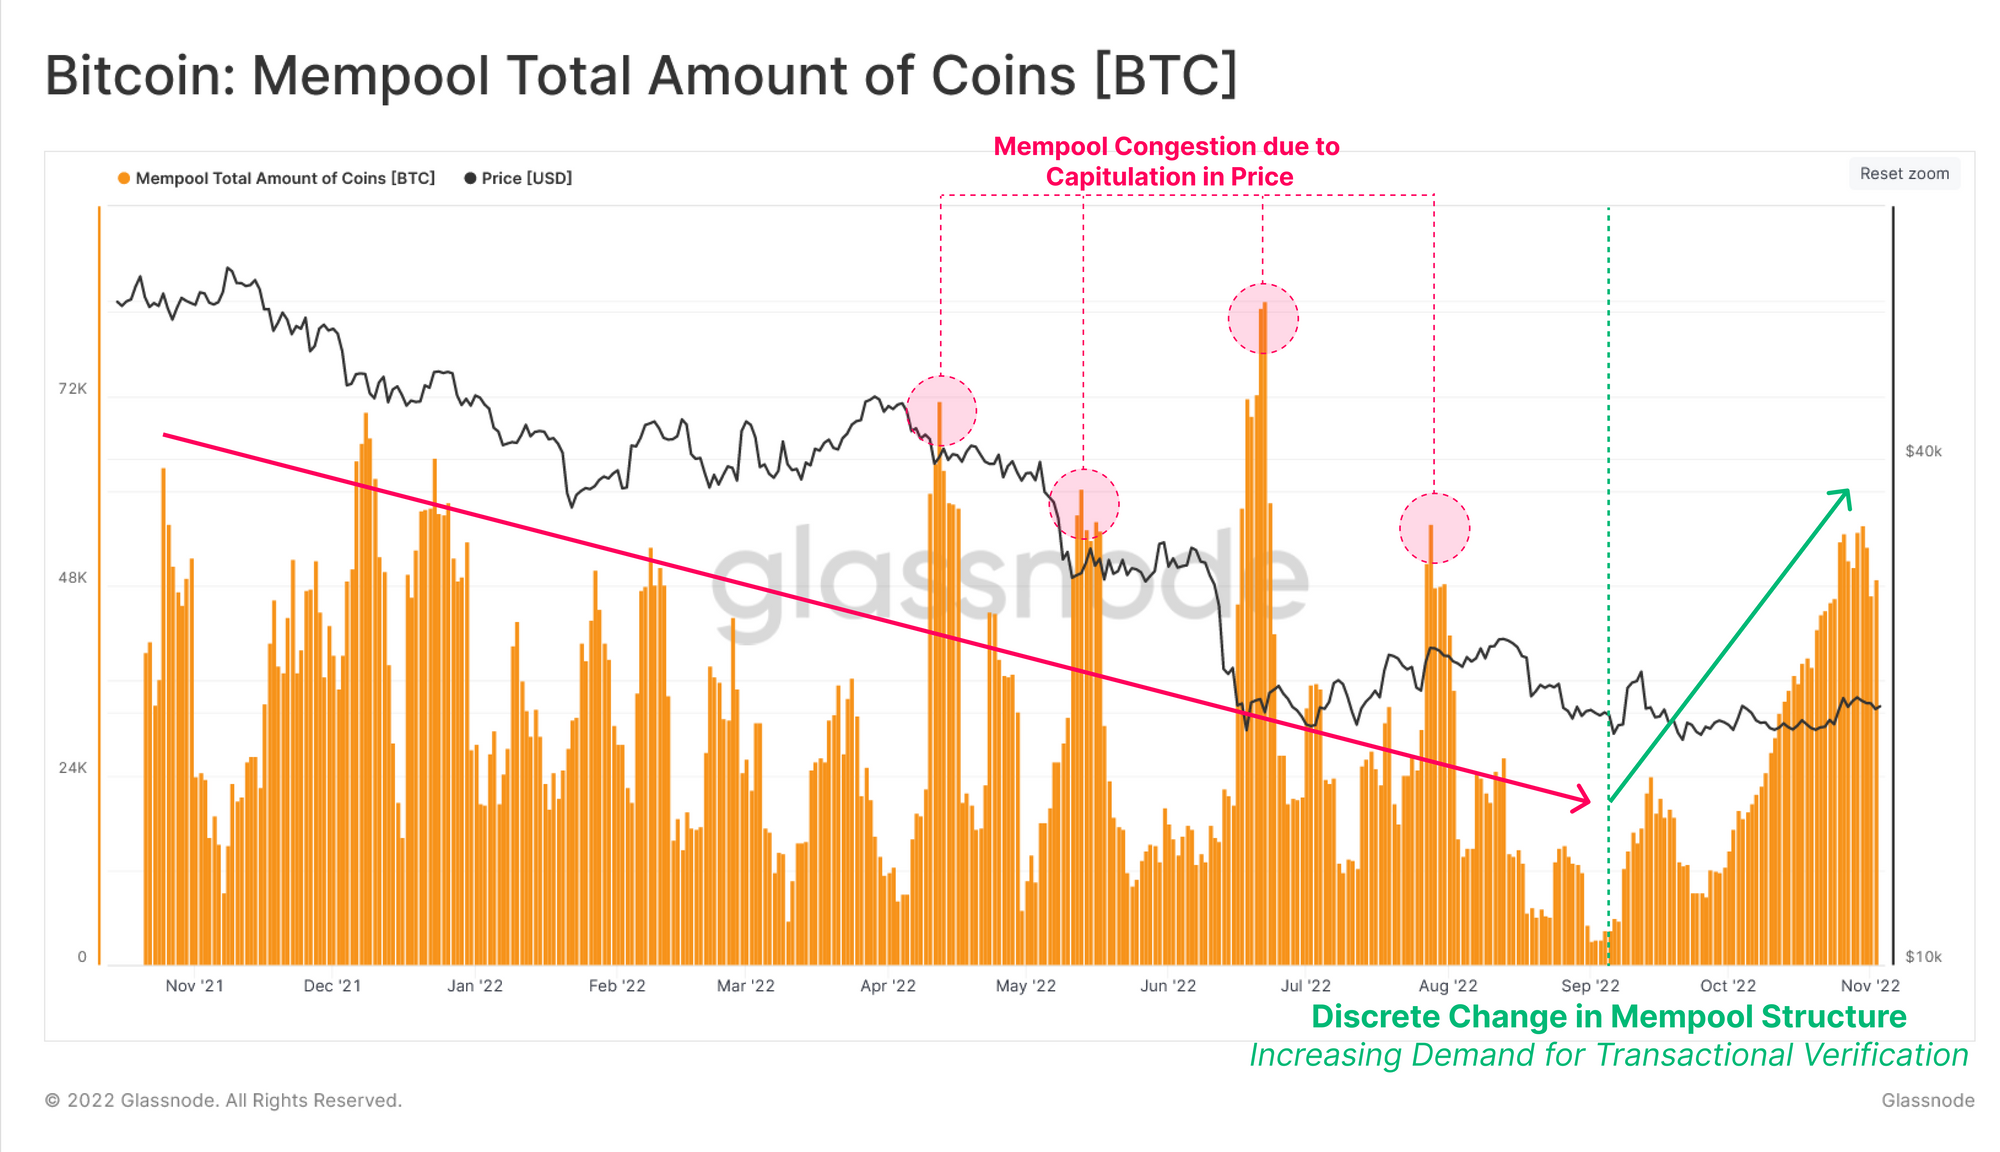
Data from Glassnode shows demand on the Bitcoin network has been gradually recovering recently, after facing months of continuous decline. Total Amount Of Coins In Bitcoin Mempool Has Been On The Rise During Past Month According to the latest weekly report from Glassnode, the BTC network has been observing a small, but sustained surge in […]

A report from Glassnode suggests Bitcoin long-term holders have already realized more profit this cycle than in most of the previous ones. Bitcoin Long-Term Holder Profit-Taking Could Hint At Late-Stage Bull Phase In its latest weekly report, on-chain analytics firm Glassnode has discussed how the cumulative profit taken by the long-term holders (LTHs) has looked […]

Newbie crypto traders should be wary of bull traps. If you suspect one is on the way, here are some tips to identify it. How to identify a bull trapHere’s how to spot a bull trap with some tell-tale indicators that one is on the way:RSI divergenceA high RSI might be an indication of a potential bull or bear trap.A relative strength index (RSI) calculation may be used to identify a possible bull or bear trap. The RSI is a technical indicator, which can help determine whether a stock or cryptocurrency asset is overbought, underbought or neither.The RSI follows this formula:The calculation....

Data from Glassnode shows that bulls who accumulated during the second half of 2020 are still holding strong, despite a surge in short-term speculation this year. Bitcoin buyers from the early phases of the bull run are still hodling despite BTC’s meteoric surge into new all-time highs, according to data shared by Glassnode.The on-chain analytics provider shared its “Realized Cap HODL Waves” chart, noting that the number of coins that were last realized on-chain in the past six months has nearly doubled from roughly 40% to 80% since the third quarter of 2020 — showing that much of the BTC....