
Ethereum Breaks Out Of Descending Triangle Pattern – Fakeout Or Recovery Rally?
Ethereum (ETH) has been struggling around the $2,200 level, with bulls unable to reclaim higher prices despite multiple attempts. The market sentiment remains bearish, as ETH continues to face selling pressure even after Thursday’s announcement of the US Strategic Bitcoin Reserve, which many had expected to boost overall confidence in the crypto sector. Related Reading: 330,000 Ethereum Withdrawn From Exchanges In 72 Hours – Supply Squeeze Incoming? As ETH hovers near critical demand levels, analysts believe that the next week will be crucial in determining its short-term direction. If....
Related News

A cryptocurrency analyst has pointed out how Zcash (ZEC) has broken above the resistance level of a Descending Triangle with its latest surge. Zcash Is Breaking Out Of A Descending Triangle In a new post on X, analyst Ali Martinez has talked about a technical analysis (TA) pattern that Zcash could be breaking out of right now. The pattern in question is a Descending Triangle, which is a type of Triangle. Related Reading: Bitcoin Surge To $72,000 Unleashes $470M Squeeze On Crypto Bears Triangles form whenever an asset observes consolidation between two converging trendlines. Like with other....
An analyst has explained how a pattern forming in the Dogecoin price may suggest a rally to $1, if historical trend repeats this time as well. Dogecoin 1-Week Price Appears To Be Forming A Classic Pattern In a new post on X, analyst Ali has discussed how DOGE seems to have been showing a classic pattern in its weekly price once again. This trend involves a technical analysis (TA) pattern called the “Descending Triangle,” which, as its name suggests, is shaped like a triangle. The pattern involves two trendlines between which the price of the asset consolidates; one of these is....

Bitcoin price has now set a handful of lower highs on the daily timeframe but has yet to make a lower low, confirming a downtrend. However, each subsequent lower high has now resulted in what appears to be a descending triangle pattern – a traditionally bearish pattern for the cryptocurrency. Will this triangle eventually break […]
Dogecoin’s price action has been quiet for months, but technical analysis shows that this quiet period may be exactly why the meme coin is worth watching again. According to a crypto pundit known as CoinForge on X, Dogecoin is repeating the same playbook it followed in 2024, when a long descending triangle eventually gave way to a violent breakout rally. The attached chart compares both structures side by side, showing the 2024 pattern before its explosive rally and the current 2026 formation now at a similar technical point. Dogecoin Repeating Descending Triangle From 2024 Dogecoin....
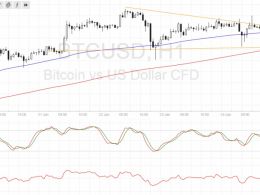
Bitcoin price is currently settling inside a descending triangle pattern and could be due for a breakout soon. Bitcoin Price Key Highlights. Bitcoin price has formed lower highs on its 1-hour time frame and found support around $900. This has led to the creation of a small descending triangle consolidation pattern on the short-term chart. The direction in which price breaks out could set the longer-term trend for bitcoin. Technical Indicators Signals. The 100 SMA is above the longer-term 200 SMA so the path of least resistance is to the upside. This suggests that a break higher could be....