
Bitcoin Could Run to New Highs as BTC Forms Tweezer Bottom at $19,000
Bitcoin has undergone its latest leg higher just recently, pushing to $19,450 on top exchanges. The coin now trades for $19,150 after a slight retracement. Analysts remain bullish as the chart remains bullish: a trader said that the coin just formed a tweezer bottom when it went to test the lows at $18,900. Bitcoin bouncing off that Fibonacci level may suggest that the trend is still in favor of bulls. Bitcoin Could Move Back Toward […]
Related News

The Dogecoin daily chart is clustering several classical support signals around $0.256–$0.265, as highlighted by Cantonese Cat (@cantonmeow) via X: “DOGE finding support. Tweezer bottom. 0.382 linear fib holding. AVWAP from cycle high holding.” On the Coinbase DOGE/USD one-day view shown, price is reclaiming the 0.382 Fibonacci retracement at $0.26537 while riding the Anchored VWAP drawn from the cycle high, with yesterday’s session marked at an open of $0.26840, high $0.27214, low $0.25680 and last $0.27119. What This Means For Dogecoin Price For readers less familiar with the terms, a....
Calls for a trip back to $20,000 or even lower were in abundance after Bitcoin collapsed by 50% and sent the market into a bearish state. However, the idea that Bitcoin has bottomed is beginning to broaden. That statement is also a double entendre, referencing a potential chart pattern which further supports the theory. Here is a closer look at the potential broadening wedge bottom pattern, how the recent market conditions fit, and what to expect if the pattern confirms. The Case For The Bottom Being In Begins To Build Bitcoin price collapsed from highs set in Q2 around $65,000 to as low....
UNI price creates more bullish sentiment as price forms rounded bottom below key resistance as price aims to break above. UNI closes the week with two bullish candlesticks. The price of UNI breaks and holds above 8 and 20 EMA. Uniswap token (UNI) has had a rough start to the year and has failed to hold key support as the price of Uniswap token (UNI) had a spiral from a high of $45 to the current price of $6.5 as price aims to break out from its long downtrend movement. The price of UNI has struggled to keep up with Bitcoin’s (BTC) range movement as this has affected most altcoins,....
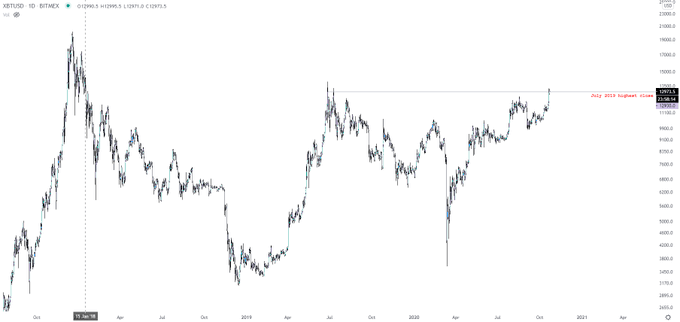
Bitcoin has undergone a strong surge over recent days, surging from under $12,000 to $13,000 as of this article’s writing. Analysts are starting to expect even more upside as the coin posts candle closes above crucial resistance levels. Related Reading: Here’s Why Ethereum’s DeFi Market May Be Near A Bottom Bitcoin Forms Pivotal Daily Close […]

The upward Ethereum trend could soon be over. Ethereum’s price has formed a flat wave, and now a turn to decline is likely to form. At which point will the upward trend be least likely to continue? After forming a correction toward the upward trend, Ethereum’s price has rebounded from the $12.5 resistance line, which we have pointed out earlier. But this wave of the trend is likely a short one, because there is a probability that it will turn out to be a wave of a flat. That’s why for the upward trend to continue, it’s necessary for this wave to be a part of that trend. It’s common....