
Glassnode Data Shows A Bullish Bitcoin Crossover Has Recently Occurred
Data from Glassnode reveals a crossover in the Bitcoin NVT price model has recently taken place, something that has historically been bullish for the crypto’s price. Bitcoin NVT Price 28-Day Curve Has Crossed Above The 90-Day As per the latest weekly report from Glassnode, the BTC NVT price model has observed a bullish formation recently. NVT stands for “Network Value to Transaction.” The NVT ratio is an indicator that measures the ratio between the Bitcoin market cap and the network transaction volume. Generally, high values of the ratio suggest that the crypto is....
Related News

The Bitcoin 20 DMA seems to have just crossed with the 50 DMA, here is how it might be bullish for the cryptocurrency. The Bitcoin Bullish Crossover As pointed out by a BTC technical analyst on Twitter, two important indicators of the cryptocurrency have just had a crossover. The two metrics are the 20 daily-moving average (DMA) and the 50 DMA. Before looking at the data, it’s best to first get a grasp of both these indicators. Moving averages (MA) help smooth out the price data for Bitcoin as they take averages of the price over a specific period and constantly update or....
On-chain data shows Solana (SOL) has seen its spot value drop under the Realized Price for the first time in three years following the recent bearish action. Solana Has Just Seen A Breakdown Of The Realized Price According to data from the on-chain analytics firm Glassnode, Solana has slipped around 8% below its Realized Price. The “Realized Price” is an indicator that basically tells us about the cost basis of the average investor or address on a given network. Related Reading: Dogecoin To $2 Could Be Next If DOGE Holds This Level: Analyst When the spot price of the asset is....
Data shows the Bitcoin fear and greed index has continued to display low values for the third straight week as the market remains fearful. Bitcoin Fear And Greed Index Currently Points At “Fear” According to the latest weekly report from Arcane Research, the BTC market has now remained fearful for the 3rd consecutive week. The “fear and greed index” is an indicator that tells us what the general sentiment among investors in the Bitcoin market currently is. The metric uses a numeric scale that runs from one to hundred for representing this sentiment. All values above....

A whale-sized XRP investor holding since more than five years ago finally transferred their coins this month, locking in a huge amount of profit. XRP Whale Recently Realized Over $721 Million In Profits In a new post on X, Glassnode senior researcher CryptoVizArt.₿ has talked about a huge profit-taking transaction that recently occurred on the […]
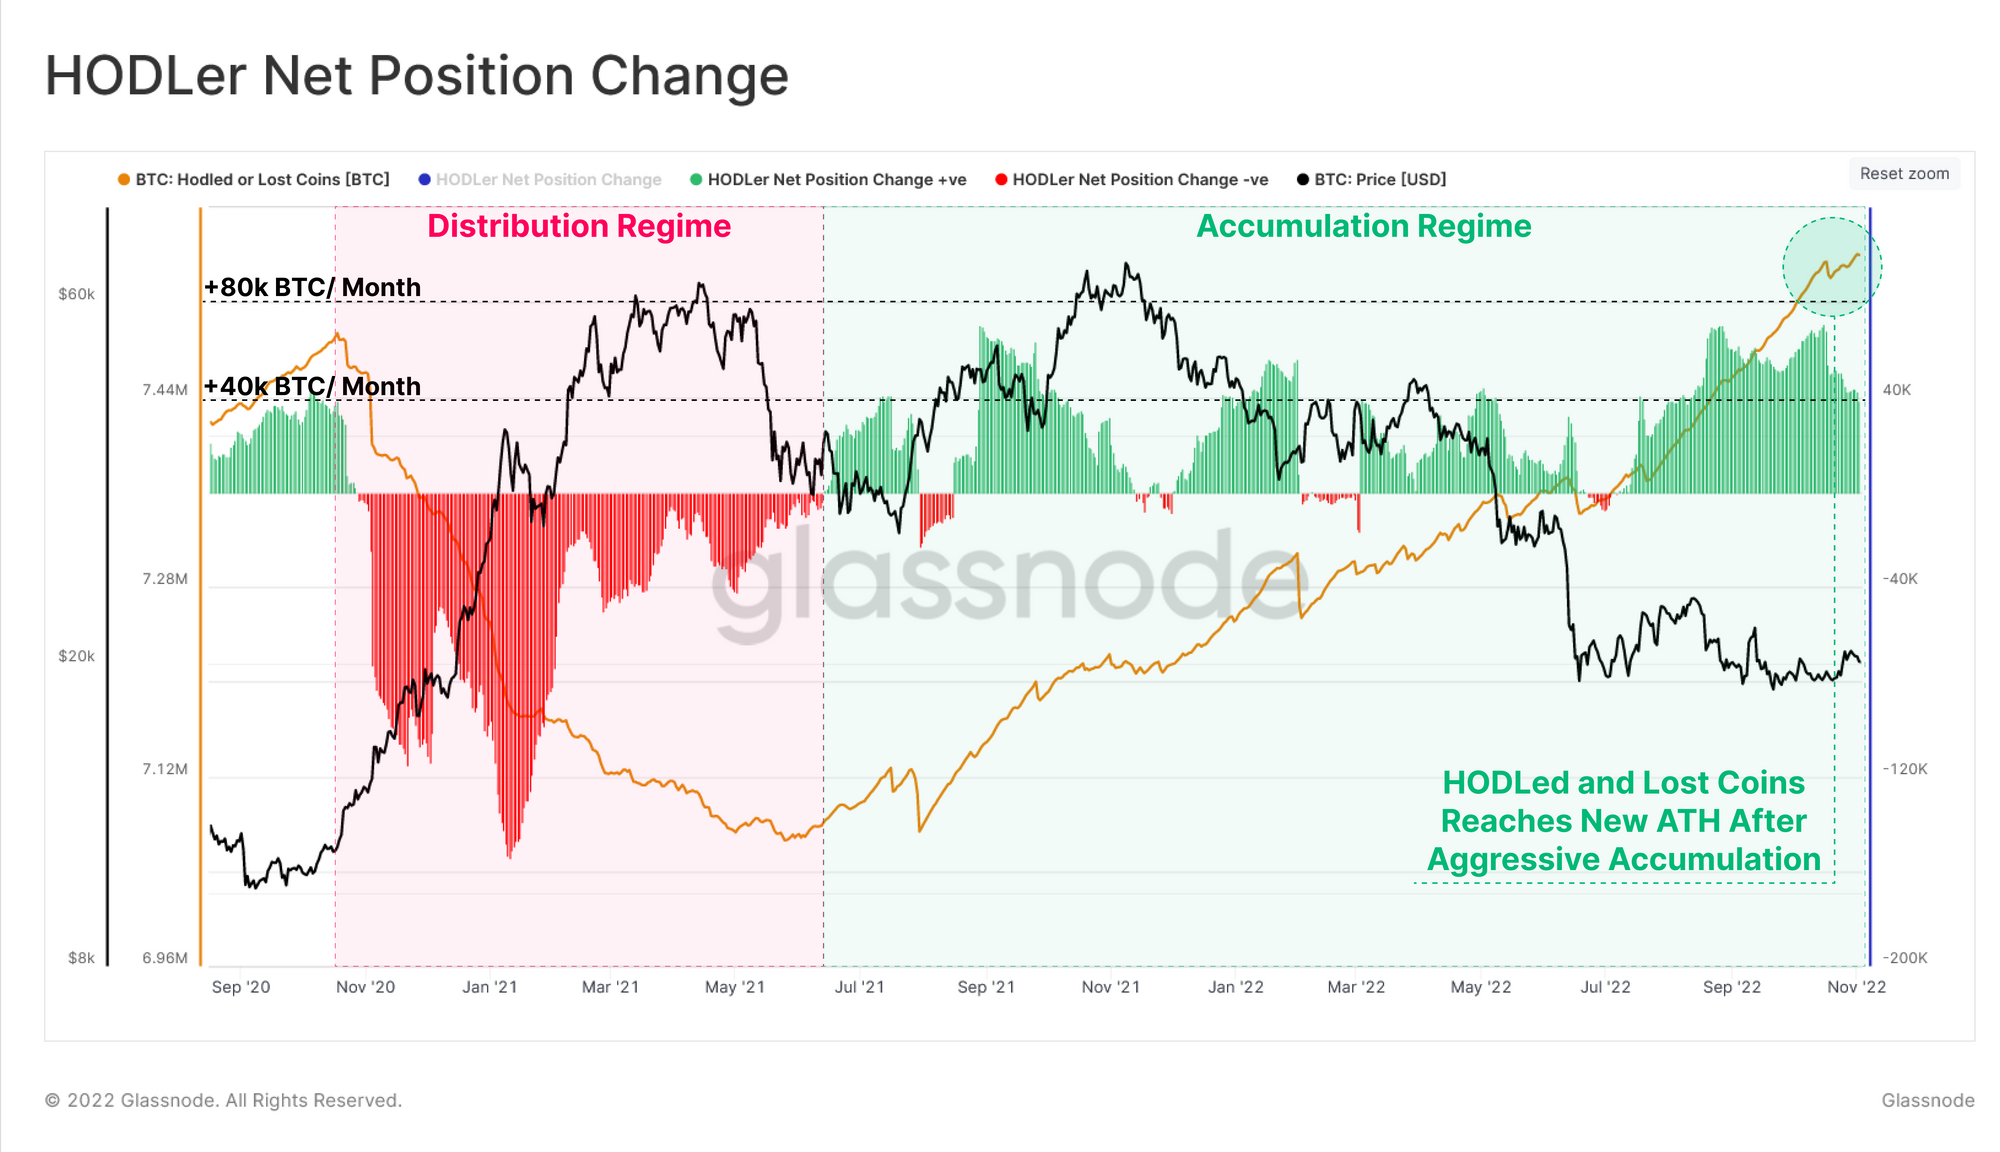
Data shows the Bitcoin supply has now reached all-time high HODLing levels, a sign that could be bullish for the price of the crypto. Bitcoin HODLed Or Lost Coins Metric Has Hit A New ATH As per the latest weekly report from Glassnode, investors have been showing some aggressive accumulation behavior recently. There are a couple of relevant indicators here. The first is the “HODLed or Lost Coins,” which measures the total number of coins that have been sitting dormant on the blockchain. Such coins either belong to the HODLers, or are simply inside wallets that have been lost....