
XRP Price Upside Move Slows—What’s Stopping the Breakout?
XRP price is correcting gains from the $2.750 resistance. The price is still showing positive signs and might aim for a move above the $2.750 resistance zone. XRP price started a fresh increase above the $2.620 level. The price is now trading above $2.620 and the 100-hourly Simple Moving Average. There is a connecting bearish trend line forming with resistance at $2.720 on the hourly chart of the XRP/USD pair (data source from Kraken). The pair might start a fresh increase if it clears the $2.720 resistance zone. XRP Price Faces Resistance XRP price remained supported above the $2.550....
Related News

Key Bitcoin Price Outlook The bitcoin price briefly surged above $61,000 on Tuesday. The climb surfaced as a part of an upside weekly session, as traders’ appetite for safe-havens surged ahead of key US inflation data. Technically, the cryptocurrency shied away from confirming a price breakout to the upside. Bitcoin rallied above $61,000 on Tuesday. The flagship cryptocurrency’s upside move was brief but left traders more confident about extended gains. Changpeng Zhao, the CEO of […]

Ethereum price starting trading in a range against the US Dollar, and it looks like the ETH/USD pair is preparing for the next move. Key Highlights. ETH price after a minor bullish wave against the US Dollar started trading in a range. There was a bearish trend line formed on the hourly chart (data feed via SimpleFX) of ETH/USD, which was broken recently. The highlighted range resistance is near $8.10 and range support is near $7.90. Ethereum Price Resistance. ETH price declined a few points towards the $7.85 level against the US Dollar. The price started a minor upside move, and broke a....
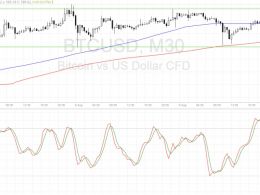
Bitcoin price is settling inside a range but technical indicators seem to be hinting at an upside breakout. Bitcoin Price Key Highlights. Bitcoin price has been moving sideways on the slowdown in volatility, stuck in a range between support at $575 and resistance at $590. Price appears to be bouncing off the top of the range once more, gearing up for another test of support. However, technical indicators are suggesting that a breakout could take place. Technical Indicators Signals. The 100 SMA is still above the longer-term 200 SMA on this time frame, signaling that the path of least....

Key Highlights. The Litecoin price declined heavily this past week and traded close to $3.55 where it found support. There was a pennant pattern formed on the hourly chart, which was broken to open the doors for an upside move. There is a major barrier on the upside around $4-4.20 where buyers may find it tough to retain traction. Litecoin price after declining, found support and currently forming a consolidation pattern that might set it for an upside move. Buying Favored. As clearly seen in the chart attached there is a critical break noted above the pennant formed on the hourly. The....
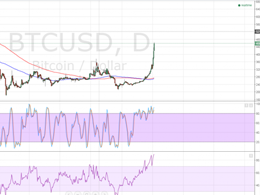
Bitcoin Price Key Highlights. The bitcoin price rally has been proven unstoppable, with bulls pushing for new highs past the $400 and $450 psychological resistance levels. Bitcoin price even completed an upside break past a double bottom formation visible on the daily time frame. Bitcoin price could be in for much more gains, as three bullish candles formed after the confirmation of a long-term uptrend signal. Aiming for $500? No signs of a major correction or even a slight pullback are materializing for now, which suggests that bullish pressure continues to build up. If so, bitcoin price....