
Indicators Suggest Biggest Bitcoin Buy Signal Since April 2020
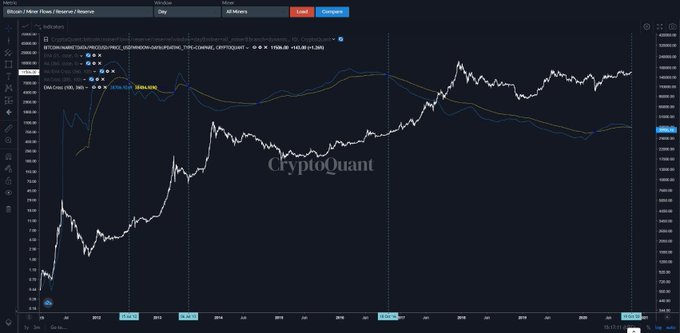
As the bull rally continues, some Bitcoin technical indicators may suggest the biggest BTC buy signal since April 2020 is here. Bitcoin Closes Above 21 Week MA And 200 Day MA As pointed out by a CryptoQuant post, the cryptocurrency has made a weekly close above the 21-week and 200-day moving averages (MAs). The Bitcoin moving average is a method used to smooth out the price data by taking the average price over a specific period of time. For the 21-week MA, data from the past 21 weeks is used, while for the 200-day MA, prices from the last 200 days are used. This method “smooths....
Related News

One of the biggest arguments going on across crypto right now, is whether or not Bitcoin price action has topped out for this cycle. After a tremendous run, a peak could very well be here, and there are several indicators that back up this theory. The creator of one of those indicators, and one that […]

The most recent balance between bid and ask prices is over, setting the bitcoin price on an upward path to $820, where another congestion area may be observed. Aside from the market determined by the biggest traders, which can be seen through volume indicators during the previous two sideways lateral movements, natural demand supremacy allows prices to leave the $580-$600 support area. Now, the new technical objective is the $820 level without intermediate resistances, in a bull pattern that could be a fast rally to place the quotes into a new formation that would drive the action even....

Bitcoin price is currently trading at around $23,500 at the time of this writing, up over 30% from lows and 10% for the week. The recovery has brought the weekly RSI out of oversold territory after reaching historical levels. Here is why the setup could be the buy signal bulls have been waiting for, and how the Relative Strength Index currently resembles the last bear market bottom. Weekly Bitcoin RSI Recovers From Historical Oversold Conditions In technical analysis, sometimes less is more. Traders commonly fill a chart with lines or indicators, desperately seeking an edge in the market.....
Bitcoin has undergone a strong rally over the past few months. From the March lows, the cryptocurrency has gained over 200%, rallying from $3,500 to $11,700 now. While already impressive, the coin is about to form a pivotal buying signal that may suggest more upside is likely. The signal in question last formed when the […]

The MACD indicator hints at a potential bullish crossover as Bitcoin’s price retests $40,000 as support. A crossover between two Bitcoin (BTC) moving averages that appeared before the 2020 price boom is hinting at making a return in 2021, just as the flagship cryptocurrency eyes a bullish breakout from its current $30,000–$40,000 trading range.The indicators in focus are the MACD Line and Signal Line. MACD is an acronym for Moving Average Convergence Divergence, and a MACD Line represents the difference between the 12- and 26-period moving averages. Meanwhile, a Signal Line is a....