
Shiba Inu Price Forms Double Bottom At Demand Zone — What To Expect
Among the top performers from the past cycle, Shiba Inu has struggled to hold its own as its price has tumbled by more than 85%. As a result, the meme coin has been pushed out of the top 20 cryptocurrencies by market cap as the price continues to struggle. However, there could be a turn in the tide for the Shiba Inu price after a major price formation at a demand level. This historically bullish move could spell the start of another major rally for the meme coin. Shiba Inu Price Shows Bottom Signal After tumbling below $0.000013, the Shiba Inu price has now reached a critical level that....
Related News

Shiba Inu (SHIB) is showing signs of a powerful comeback as fresh bullish signals emerge on the charts. A rare divergence pattern is fueling speculation of a massive reversal, with analysts eyeing a potential rally that could stretch as high as $0.000081. But can SHIB really sustain the momentum for such an explosive rally? Bullish Divergence Sparks Hopes Of A Reversal In a recent update shared on X, Javon Marks revealed that Shiba Inu has confirmed a bullish pattern through a regular bullish divergence on the MACD histogram. This technical development signals a notable shift in momentum....

Many successful traders look for double bottom and W bottom reversal patterns on technical charts in order to spot powerful price reversals. Trading in the direction of the trend is one of the best ways to be profitable. If traders learn to spot a new trend early, it provides an opportunity to buy with a good risk to reward ratio. In addition to identifying a trend, traders should also be able to recognize when it has reversed direction.While several patterns signal a possible trend change, one of the easiest to spot is the double bottom pattern. This can help traders change their strategy....
Bitcoin is forming a double bottom pattern near the $45,500 zone against the US Dollar. BTC is rising and there could be an upside break above $47,200. Bitcoin started an upside correction from the $45,500 support zone. The price is now trading near $47,000 and the 100 hourly simple moving average. There is a major bearish trend line forming with resistance near $47,000 on the hourly chart of the BTC/USD pair (data feed from Kraken). The pair could start a major increase if there is a clear move above the $47,000 resistance. Bitcoin Price Forms Double Bottom Bitcoin price declined again....
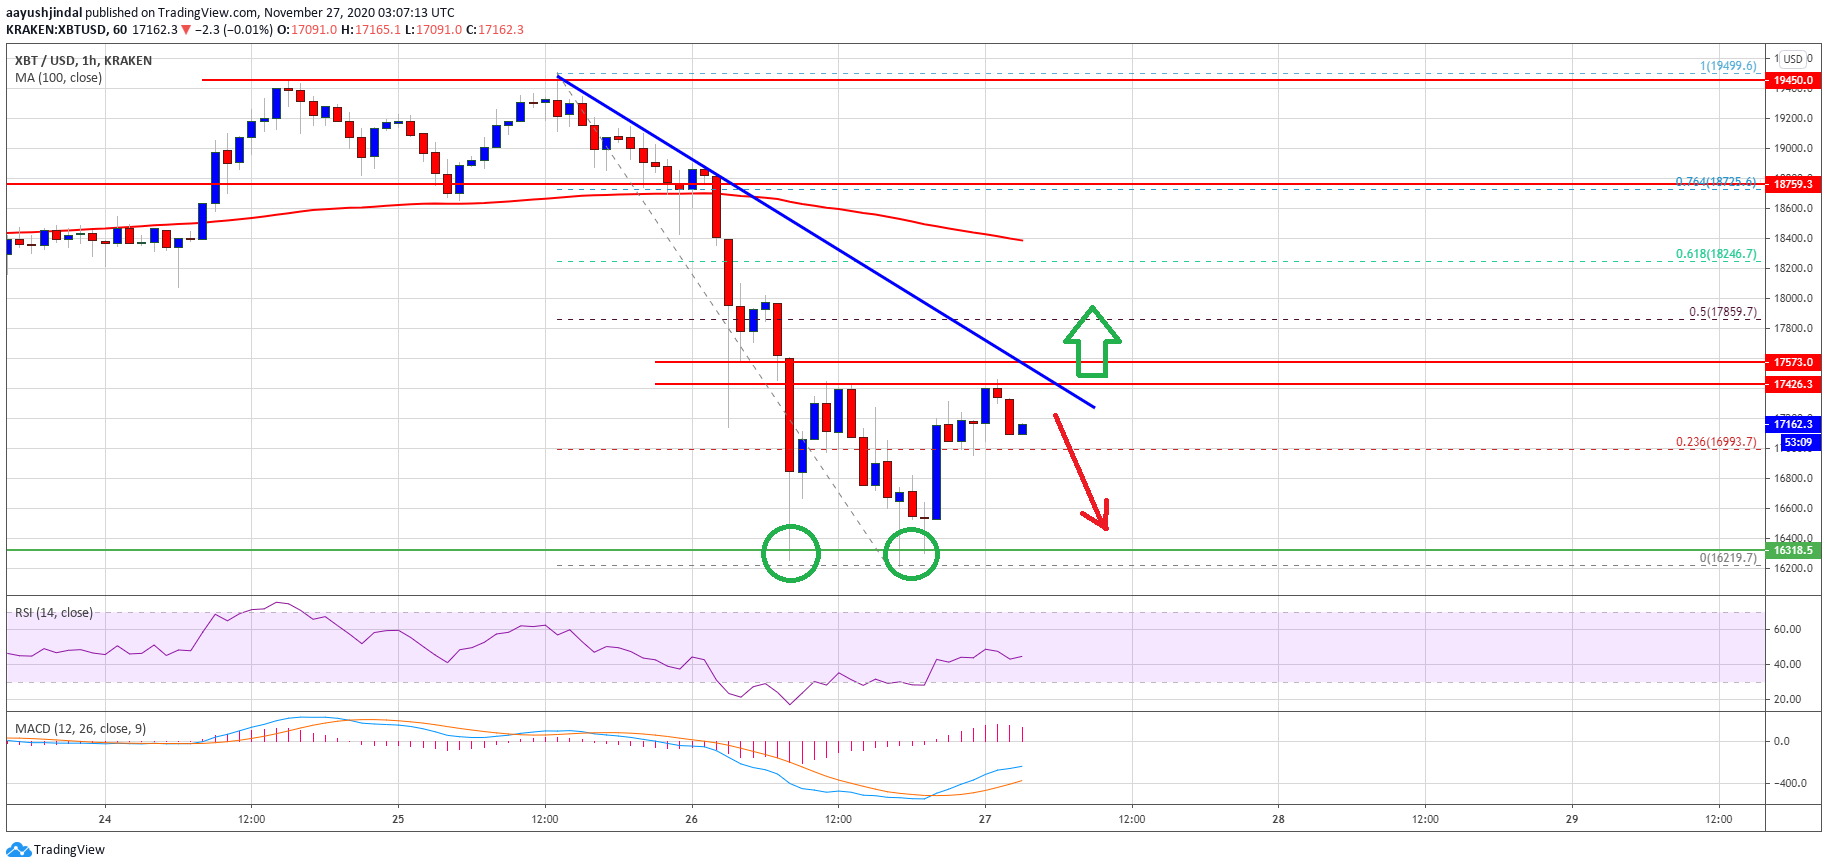
Bitcoin price declined heavily, but it found support near $16,300 against the US Dollar. BTC is likely forming a double bottom pattern and it could rally if it clears $17,500. Bitcoin is holding the $16,300 support zone and trading above $17,000. The price is facing a strong resistance near $17,500 and it is well below […]

The Dogecoin and Shiba Inu prices have witnessed double-digit crashes in the last few days, sparking a bearish sentiment for the foremost meme coins. This price decline has occurred due to several factors, including Trump’s tariffs on Mexico and Canada. Why The Dogecoin And Shiba Inu Prices Have Crashed Double Digits CoinMarketCap data shows that […]