
XLM Depicts Buying Resurgence, Where’s It Headed Next?
XLM price picked up momentum after the coin retraced on its chart over the past week. Over the last 24 hours however, XLM appreciated by 3.6% and was successful in toppling over its immediate resistance mark. The bulls were back in charge and the technical outlook of XLM also portrayed the same sentiment. Currently, XLM price has become steady on the $0.121 level. Over the past few days, XLM has consistently formed higher highs and higher lows which is a sign of bullishness in the market. If the altcoin is able to hold onto its price momentum, then the coin could eye the $0.130 price....
Related News

The ECB says the additional monetary policy actions were needed because of a resurgence in coronavirus cases.

Bitcoin and cryptocurrencies are once again a hot topic, being discussed across the broader financial space the most since Facebook’s Libra cryptocurrency was first announced. On the heels of the recent resurgence in the crypto market, rumors suggest that Facebook could be ready to launch Libra as early as January 2021. What sort of impact would its launch have amidst the recent Bitcoin resurgence and any upcoming altcoin season? Will Bitcoin Benefit Again From Facebook’s […]

Polkadot has displayed negative sentiments on the chart today. Over the last three months, the coin had continued to hold its prices above the $14.40 price mark. At press time today, DOT was trading extremely close to that level. This comes after Polkadot had registered a price hike to $19 during the third week of last month. The bulls had tried very hard to defend the prices at the $16 price support level. DOT went on a slide and it hasn’t halted since. Prices of the asset tried to trade above the aforementioned support line and tried to push the price north but it seems like aiming....
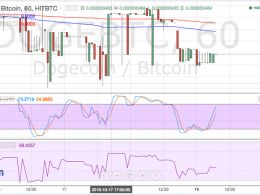
Dogecoin Price Key Highlights. Dogecoin price is moving in a much larger range compared to its previous tight short-term consolidation. Price seems to have bounced off the bottom of the range around 43 to 44 Satoshis and may be headed back to the top. Dogecoin price stepped up its volatility in the recent trading range, breaking below its short-term consolidation but still unable to make further headway south. Headed for resistance? Technical indicators on the 1-hour chart of dogecoin price suggest that it is headed back towards resistance at 48 Satoshis. Stochastic is pointing north,....

The latest survey from BlockFi shows that women are more interested in cryptocurrencies than ever, with one-third planning on buying digital assets this year. Furthermore, 60% of these women say they will be doing so within the next few months. The current survey depicts double women’s interest compared to the exact nature of the study […]