
Classic bearish chart pattern forms for Bitcoin as BTC price tumbles to $32K
Bitcoin flashes a classic bearish technical pattern that could crash BTC prices to below $20,000. Bitcoin (BTC) bulls should look for a cover, at least as far as chart technicals are concerned.The flagship cryptocurrency continued its price declines into the new weekly session, hitting $32,105 ahead of the London opening bell following an approximately 10% intraday drop. In doing so, it raised the prospect of retesting its quarter-to-date low of $30,000 for either a bearish breakdown or a bullish pullback.Bitcoin consolidates between $30,000 and $42,000. Source: TradingViewBut as traders....
Related News

Crypto analyst Titan of Crypto has highlighted a bearish pattern on Bitcoin’s dominance chart, suggesting that altcoin season might be on the horizon. The analyst expects these altcoins to make massive moves soon enough, having experienced significant declines for some time now. Bitcoin Dominance Chart Forms Bearish Pattern Titan of Crypto mentioned in an X […]

The classic bearish setup projects Litecoin price potentially falling to $200 in the coming sessions. A 37% November price rally in Litecoin (LTC) risks exhaustion as the "silver cryptocurrency" hints at forming a Double Top chart pattern.The classic bearish reversal setup appears when the price forms two consecutive peaks of almost the same height, with each upside move meeting with a strong correction towards a common support level, called the "neckline." Typically, the price breaks below the support and falls by as much as the maximum height between the Double Top's peak and neckline.So....
Bitcoin is once again at a critical technical crossroads, with a widely discussed chart structure suggesting that a sharp decline could be on the table. A recent analysis shared on X by crypto trader @0xPepesso points to a classic bearish continuation pattern that, if confirmed, could erase as much as $30,000 from current price levels. […]
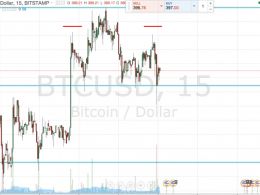
It’s been a strange few days in the bitcoin price space. A number of fundamental developments seem to have reversed the negative general sentiment from the beginning of last week, and the bitcoin price looks to reflect this reversal. However, a look at the charts from a technical perspective suggests there could be some medium term weakness. We’ve detailed head and shoulders pattern before, but for our readers that haven’t come across these patterns in our analysis yet, they are a pretty common classical technical charting pattern used in more traditional financial asset trading. They come....

Ethereum classic price is currently trading in a range, which is contracting and may break soon for the next leg in ETC/BTC. Key Highlights. Ethereum classic price continued to trade in a range versus Bitcoin, but approaching a break soon. Yesterday’s minor bearish trend line on the hourly chart of ETC/BTC (data feed via Simplefx) is still in play and acting as a barrier. The price needs to break either resistance or support for the next move going forward. Ethereum Classic Price Support. Ethereum classic price slowly and steadily moved inside a tiny range on the hourly chart versus the....