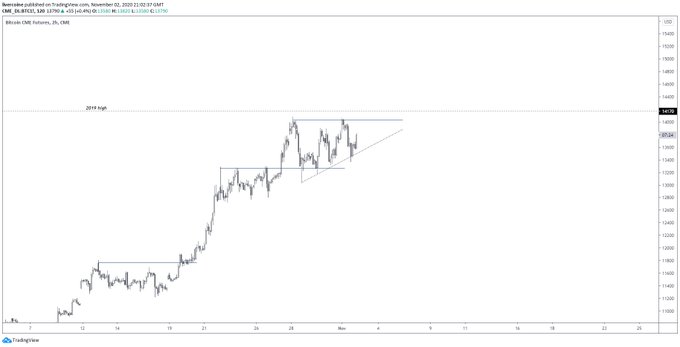
CME Bitcoin Market Is Trading in Bullish Ascending Triangle Pattern
Bitcoin has undergone a drop since peaking at $14,100 on Saturday. On Monday morning, the leading cryptocurrency fell as low as $13,200, marking a 6.5% drop from the highs. Bitcoin has since bounced to $13,700 as of this article’s writing. While the cryptocurrency remains below the $14,000 technical resistance, analysts remain optimistic about the digital […]
Related News

The cryptocurrency market is trending bearish on the short-term, keeping Bitcoin and Ethereum prices at bay after an enormous Q1 2021 rally. But there is no telling if the bull market is officially over, or if a bounce could materialize into a larger recovery. An ascending triangle pattern and long-term trend line could provide a clue as to what might happen next, and it just so happens to match a pattern from the last cycle that took Ether to its bull market peak. The Ethereum Fractal That Could Keep The Bull Run Climbing Ethereum’s recent local top set back in April around $4,400....
Ethereum price is trading at roughly $1,550 after failing to get back above $2,000 throughout the entirety of 2023 thus far. Increasingly higher lows during the year and a horizontal resistance zone had formed an ascending triangle – a potentially bullish chart pattern. This pattern, however, is possibly failing. A busted pattern target could send the price per ETH sub-$1,000. Is the bullish chart pattern breaking down? | ETHUSD on TradingView.com Ethereum Ascending Triangle Begins Breakdown: Target $700 Ethereum put in its bear market low back in June of 2022 while Bitcoin and other....
Solana is currently breaking above an Ascending Triangle that could set a target of around $300, according to a cryptocurrency analyst. Solana Is Breaking Out Of An Ascending Triangle In a new post on X, analyst Ali Martinez has discussed about a triangle technical analysis (TA) pattern forming in the 12-hour price of Solana. The pattern in question is an “Ascending Triangle,” which appears whenever an asset’s price consolidates between two converging trendlines. Related Reading: Solana Social Media Hype Hits 11-Week High As Price Jumps 16% The special feature of the....
A cryptocurrency analyst has pointed out how support could lie between the $0.60 and $0.90 levels for XRP, based on this technical analysis (TA) pattern. XRP Could Be Moving Inside An Ascending Triangle In a new post on X, analyst Ali Martinez has shared a TA pattern forming in the monthly price chart of XRP. The pattern in question is an Ascending Triangle, which is a type of triangle. Triangles form whenever an asset’s price trades between two converging trendlines, with the upper level acting as a source of resistance, while the lower one that of support. Related Reading: Ethereum....

In classical technical analysis, an ascending triangle forms either as a continuation pattern midway through an uptrend or as a reversal pattern at the end of a downtrend. A break out of the triangle (i.e. a candlestick close above the upper channel) signifies a pattern completion, and infers a target of at least the height of the triangle in question. A quick look at the 15 minute price chart on the bitstamp feed reveals just such a pattern, and - therefore - offers up a bullish bias for the latter half of this week. We are currently trading just shy of 237, and approaching the apex of....