
Polkadot Trades Sideways, Key Levels To Monitor For DOT
The price of Polkadot has been trading sideways within a narrow range of $5.7 to $6.6 in recent days, with a slight uptick of only 0.7% in the past 24 hours indicating consolidation. The weekly chart shows a decline of 1.7%, and the technical outlook is bearish with decreasing demand and accumulation. Although buying pressure is still present above the $6.10 mark, the ongoing consolidation has caused a decline in buyers’ confidence. If buyers fail to act soon, Polkadot could drop below its current price level and reach its local support level. Similar to Polkadot, other altcoins have....
Related News

Bitcoin is trending sideways into the long U.S. weekend with the price of BTC compressing around $19,500 and $20,500. The support around the lower zone of this range might be tested as the number one cryptocurrency struggles to preserve its current levels. Related Reading: AVAX Posts Over 2 Million Transactions Over The Weekend, New Highs Seen At the time of writing, Bitcoin (BTC) trades at $19,900 with a 1.4% profit over the past 7 days and sideways price action in the last 24 hours. BTC’s price is heavily underperforming other cryptocurrencies as Ethereum (11%), Cardano (14%), and....
Bitcoin keeps on moving sideways as the weekend approaches and, with less trading volume on exchange platforms, the cryptocurrency hints at potential losses. BTC’s price has surrendered the gains from the past week but has been able to hold to its current levels as critical support. Related Reading: TA – Polkadot Price Shows Strength, Eyes $10 At the time of writing, Bitcoin (BTC) trades at $23,000 with sideways movement over the past 24 hours and a 3% loss over the past week. The first cryptocurrency by market cap has been severely outperformed by Binance Coin (BNB) and Polkadot as risk....
Polkadot price has retraced on its chart over the last 24 hours. The coin has started to register sideways movement on its one-day chart. During this period, the coin lost close to 2% of its market value. In the last week, DOT registered more than 6% appreciation, which caused the bulls to gain stamina and break past the consolidation phase. The technical outlook for the coin remained positive; however, the indicators indicated that the bullish momentum was fading off the charts. Bitcoin also retraced slightly on its chart. Many altcoins have also started to trade sideways following....
Over the last week, Polkadot shot up by 16% pushing DOT to trade at $21.15 at the time of writing. The bullish momentum helped the coin to trade above the $20 support level. Over the last 24 hours, DOT lost 2% of its market value. The coin was seen oscillating between $22.62 and $21 at press time. Polkadot had tried to breach the $22.62 resistance mark for quite some time over the past few days. The bulls were rejected each time as the aforementioned price ceiling has acted as a robust one. Although DOT flashed sideways trading, the bulls managed to keep prices above the 20-SMA line in....
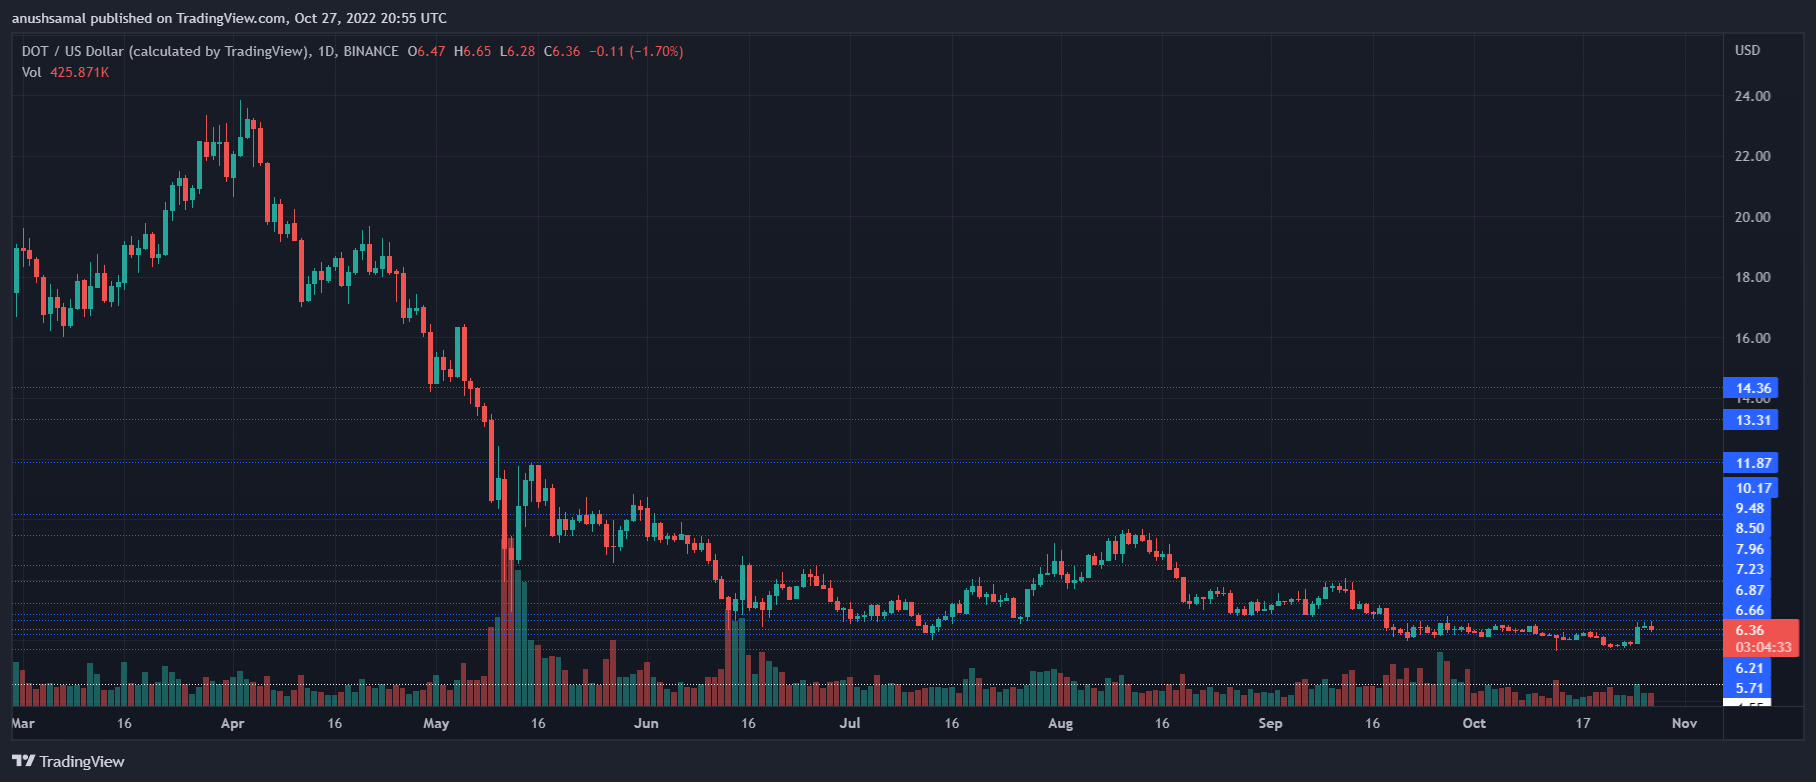
Polkadot has witnessed continued downfall in price since the last month. It has now established its support level at $6.30, however, the coin has been trading very close to that support level. After it broke below the $6.66 support line, the coin has spiralled downwards. It retested the $6.30 level the past month. Technical outlook for the coin displayed build up of bullish pressure. The price of the altcoin has remained sandwiched between the $6.58 and $6.30 levels over the last trading sessions respectively. DOT has continued to face rejections at the $7 level and that had exhausted the....