
Bitcoin Realized Price For New Whales Marks Strongest Support For Current Con...
Bitcoin has experienced lackluster price action over the past few days, trading in a narrow range between $94,700 and $98,600 since last Friday. This stagnant movement has added to the speculative environment, leaving the market uncertain about short-term direction. Neither bulls nor bears have been able to take control, creating a sense of indecision among […]
Related News

On-chain data shows the short-term holder Bitcoin whales have recently increased their Realized Cap share to the highest level ever. Bitcoin Is Currently Being Dominated By New Capital In a new post on X, CryptoQuant community analyst Maartunn has talked about the latest trend in the share of the Bitcoin whale Realized Cap held by the short-term holders. The Realized Cap here is an on-chain indicator that measures, in short, the total amount of capital that the BTC investors as a whole have put into the cryptocurrency. Changes in this metric reflect the incoming or outgoing of capital.....
On-chain data shows the large Bitcoin holders have been participating in a notable amount of loss realization recently, a sign of capitulation. Bitcoin Sharks & Whales See High Values On Realized Loss Metric In a new post on X, on-chain analytics firm Glassnode has talked about the latest trend in the Bitcoin Realized Loss for the sharks and whales. The “Realized Loss” here refers to an indicator that measures, as its name suggests, the total amount of loss that BTC holders are realizing through their transactions. Related Reading: Ethereum Drops Nearly 5% As Familiar Leverage....
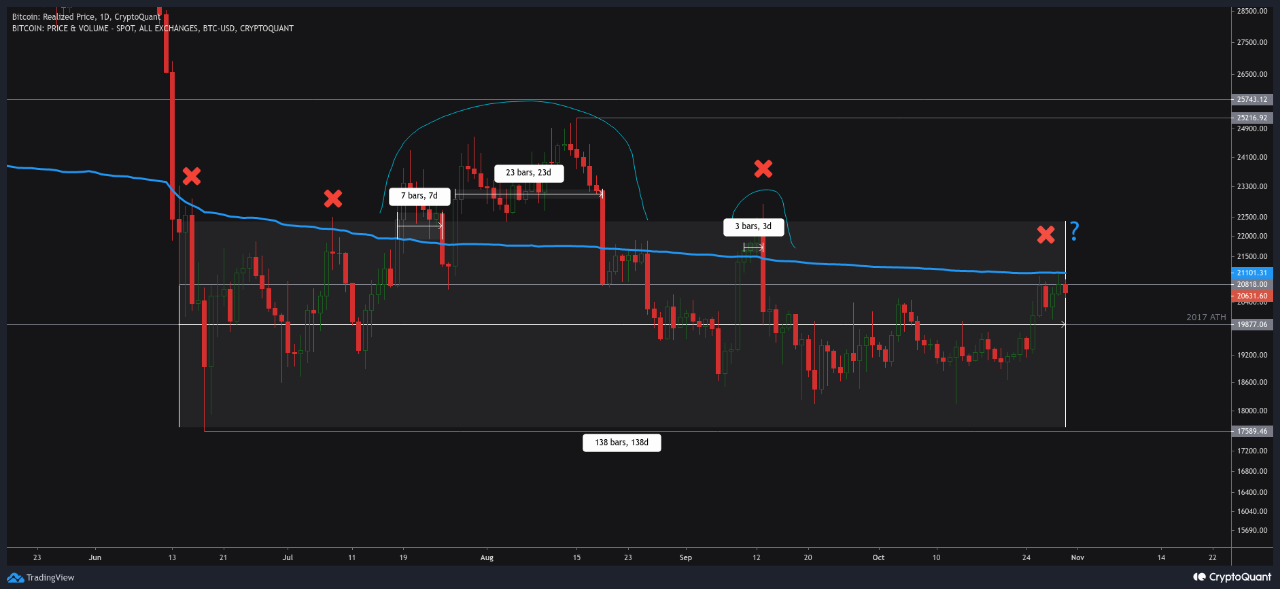
Data shows Bitcoin is now approaching another retest of the realized price, will the bulls be able to blow through the resistance this time? Bitcoin’s Recent Upwards Momentum Has Brought It Near Realized Price Again As pointed out by an analyst in a CryptoQuant post, BTC has spent a total of 138 days under the realized price so far since the June of this year. Before we look at the data for the Bitcoin realized price, it’s best if a basic understanding of the “realized cap” is attained first. The realized cap is calculated by multiplying each coin in the circulating....
On-chain data shows that the Bitcoin short-term holder whales have a cost base above $64,000, which could be a potential resistance point for BTC. Bitcoin Is Not Far From Realized Price Of Short-Term Holder Whales After Rally As pointed out by an analyst in a CryptoQuant Quicktake post, the BTC price had slipped below the Realized Price of the short-term holder whales earlier. The “Realized Price” here refers to an indicator that keeps track of the average cost basis that the investors of a particular group currently share. Related Reading: Bitcoin NVT Golden Cross Gives Bottom....
Over the last week, the Bitcoin price has continued to see sustained selling pressure, with the flagship cryptocurrency trading around $73,400. According to recent on-chain data, changes in key market structures suggest Bitcoin might remain in this bearish state in the near to mid-term. Related Reading: Bitcoin Has Hit A Ceiling, Analyst Says No Buying Until Price Hits This Level Realized Cap Metric Reflects Growing Capital Outflows In a recent post on QuickTake, on-chain analyst Carmelo Alemán revealed a notable decline in Bitcoin’s Realized Cap values. The analyst notes that,....