
A Geopolitical Picture Of The Bitcoin Price Breakout
Bitcoin broke out of a range to reach almost $21,000. What’s happening with currencies around the world that may be influencing this price action?“Fed Watch” is a macro podcast, true to bitcoin’s rebel nature. In each episode, we question mainstream and Bitcoin narratives by examining current events in macro from across the globe, with an emphasis on central banks and currencies.Watch This Episode On YouTube Or RumbleListen To The Episode Here:AppleSpotifyGoogleLibsynIn this episode, CK and I cover extremely important updates for the future of the global economy.....
Related News
Upside Breakout. Hourly Bitcoin Price on Bistamp with Fibs, Support/Resistance/Trend Lines and MACD. The trading range Bitcoin found itself mired in for the last few days has finally broken to the upside. After the fall from $1000 (Bitstamp rate), the Bitcoin price found strong support and bottomed around $800, as suggested in my last trading update. Bitcoin price then struggled to rise above the 38.2% Fib or $850 level. Now broken to the upside, this level will likely act as support as Bitcoin price currently falls to retest the breakout. The next immediate challenge is the 50% Fib, which....

Bitcoin has shown remarkable resilience despite growing geopolitical turmoil. After days of uncertainty fueled by escalating conflict between Israel and Iran, BTC has held the crucial $104,000 support level and is now pushing into higher price territory. The strength in price action signals that bulls remain firmly in control, even as global markets remain on […]

Ethereum has finally crossed over the downward sloping resistance line, albeit on a low volume, which fails to induce any confidence in the breakout. As can be seen from the 2-hour ETH-XBT price chart taken from Kraken exchange, there is no visible surge in volume reading even after the resistance has been taken out. A major contribution in ETH/XBT price rise is the sudden collapse in Bitcoin price. A free falling Bitcoin will aid this pair. Ethereum is currently trading at 0.00240BTC. The technical picture suggests that Ethereum will face significant selling pressure 0.00283BTC even if....
Bitcoin has reacted as expected to the conflict between the United States and Iran, continuing a pattern that has always appeared during previous geopolitical escalations. Crypto prices are digesting the latest developments, and analysts are comparing the current price structure to similar moments in 2022 and 2023, when Bitcoin initially sold off before staging strong […]
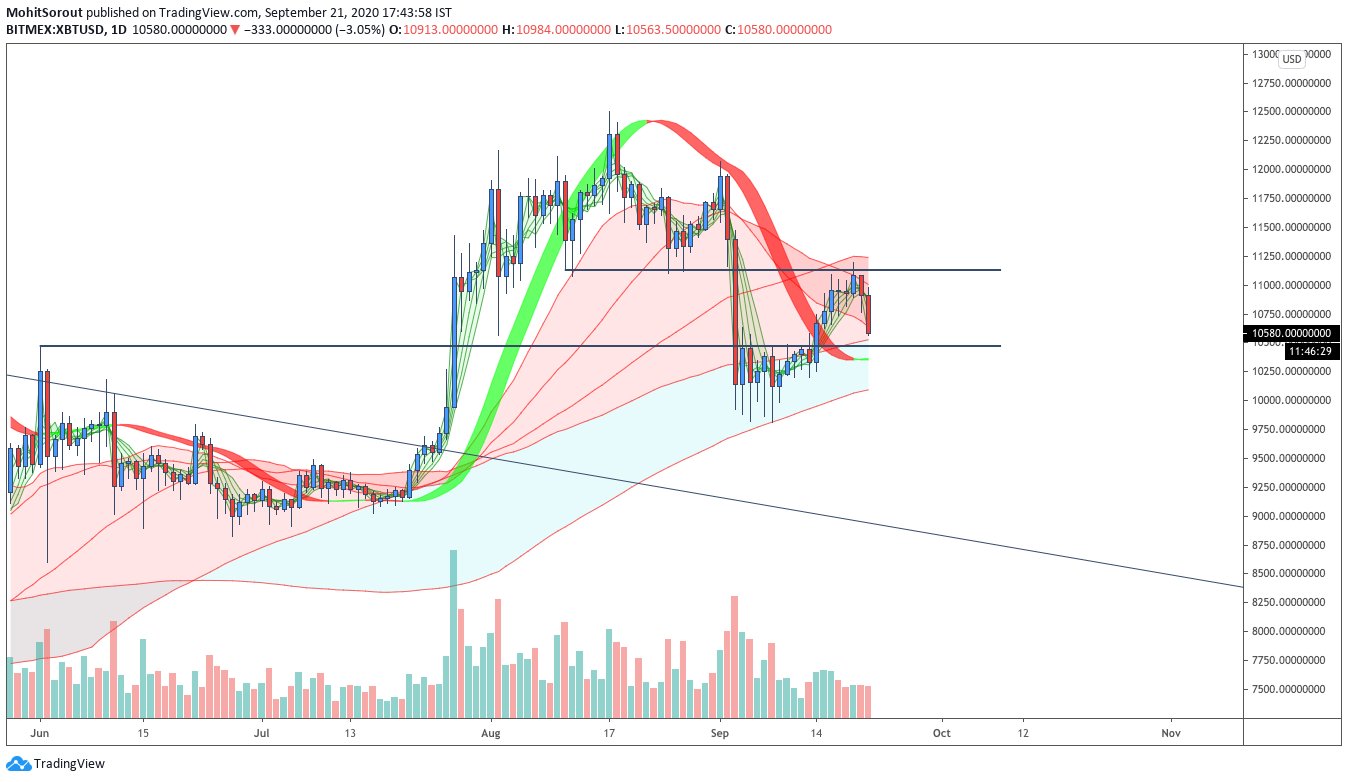
Bitcoin has faced a strong correction in the past 24 hours, dropping to $10,400. This comes after the coin hit $11,200 last week in a breakout that some thought would take the coin to $12,000. Bitcoin’s weakness comes as legacy markets like the S&P 500 have bled lower due to a number of geopolitical and macro trends. Analysts are still optimistic about BTC’s price action despite the recent weakness. One fund manager in the space […]