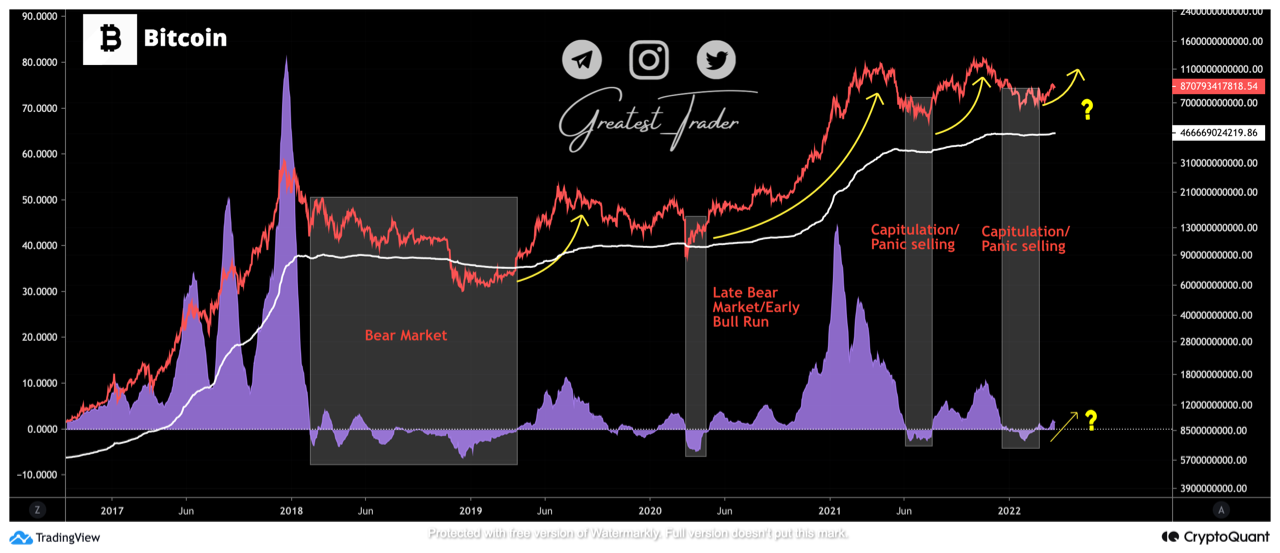
Latest Trend In Bitcoin Realized Cap Suggests A Bullish Pattern
The current trend of the Bitcoin realized cap has formed a pattern that has historically been a bullish signal for the crypto’s price. Bitcoin Realized Cap 30-Day Rate Of Change Has Turned Positive As pointed out by an analyst in a CryptoQuant post, the BTC realized cap 30-day rate of change has just turned positive […]
Related News
According to Ki Young Ju, CEO of CryptoQuant, the Bitcoin current market dynamics suggest a bullish phase that could extend well into April 2025. Ju’s analysis comes amid BTC’s current uptrend, which appears to be a continuation of that seen in March, when BTC achieved a new all-time high, surging above $73,000 for the first time. Related Reading: Analyst Utilizes Supply And Demand Principles To Determine Bitcoin Price Bitcoin Market Cap Growth Indicates Prolonged Uptrend, Says CryptoQuant CEO Notably, Ki Young Ju’s prediction stems from an analysis of Bitcoin’s market....
The Bitcoin price action is showing strong bullish signals, as a rare Inverse Head and Shoulder pattern has just broken out and retested its neckline. This technical setup suggests that Bitcoin could be gearing up for a mega rally to $300,000 soon. Analyst Forecasts Bitcoin Price Reversal On Monday, crypto analyst Gert van Lagen took to X (formerly Twitter) to forecast an imminent Bitcoin price surge to $300,000. The analyst presented a detailed price chart depicting the formation of an Inverse Head and Shoulder pattern, showcasing its left shoulder, head, right shoulder, and neckline.....
On-chain data shows the Bitcoin short-term holder RVT has plummeted recently. Here’s what history suggests could happen next for BTC. Bitcoin Short-Term Holder Realized Value RVT Is Approaching Cycle Lows In a new post on X, on-chain analytics firm Glassnode has shared the latest trend in the Bitcoin Realized Value RVT of the short-term holders. The Realized Value RVT is an oscillator that measures the ratio between the sum of profits and losses being realized by BTC investors, and the total transfer volume on the network. In simple terms, what the metric tells us about is whether....
On-chain data shows that a Chainlink indicator is currently forming a pattern that has led to an average 50% increase for LINK in the past. Chainlink 30-Day MVRV Ratio Has Plunged In a new post on X, analyst Ali discussed the latest trend in Chainlink’s 30-day MVRV ratio. The “Market Value to Realized Value (MVRV) ratio” is a popular on-chain indicator that tracks the ratio between LINK’s market cap and realized cap. The market cap naturally refers to the total valuation of the asset’s circulating supply at the current spot price. In contrast, the realized cap....
The Solana price has been in red-hot form over the past week, making a play for a new all-time high this weekend. United States President-elect Donald Trump successfully launched the Official Trump (TRUMP) meme coin on the Solana network, triggering the latest bullish momentum for the SOL token. This recent burst of positivity has now pushed Solana into an exciting price setup, which could see its value skyrocket over the next few months. According to a popular crypto analyst on social media platform X, the Solano price could be on its way to $4,700. Is SOL Price Gearing For A Parabolic....

