
Ethereum Price Lags Below $4,000—Support Levels To Watch
The Ethereum price has been one of the best performers in the cryptocurrency market in the third quarter, reaching a new all-time high at the end of August. However, the second-largest cryptocurrency has struggled to build on this record-setting momentum in September. With September and the third quarter of 2025 almost done, the Ethereum price appears to be struggling to reclaim the psychological $4,000 support level. Below are the critical support levels to watch for should a deeper correction occur, according to the latest on-chain data. Is $3,500 The Next Stop For ETH Price? In a....
Related News

Ethereum is struggling to push past resistance as the market faces a wave of uncertainty that has kept the price pinned below levels that would signal a genuine recovery. The price action is frustrating — buyers keep arriving but cannot sustain the momentum needed to break through — and CryptoQuant data has surfaced a signal […]

The Bitcoin price has had a mixed performance in August, starting with a positive run-up to a new all-time high above $124,000. The premier cryptocurrency, however, has struggled to sustain this momentum in the final two weeks of the month. On Friday, August 29, the price of BTC fell to a six-week low of around $107,500, mirroring the widespread bearish sentiment in the market going into the weekend. While the market has been somewhat stable over the past day, the Bitcoin price has failed to show any real intent of breaking above the psychological $110,000 level. BTC Investors Should Look....
Prominent analytics firm Glassnode has shared new on-chain insights into the Bitcoin market, pointing to the next major support zone amid a euphoric market mood on Friday. The world’s leading cryptocurrency briefly surged to above $117,000 after comments from US Federal Reserve Chairman Jerome Powell signaled a possible shift away from the central bank’s long-standing hawkish stance. Related Reading: When Will Bitcoin Bottom Out? This Could Be The Signal To Watch Bitcoin’s Crucial Defense Level At $104,000–$108,000: Data In an X post on August 22, Glassnode explains that Bitcoin’s UTXO....
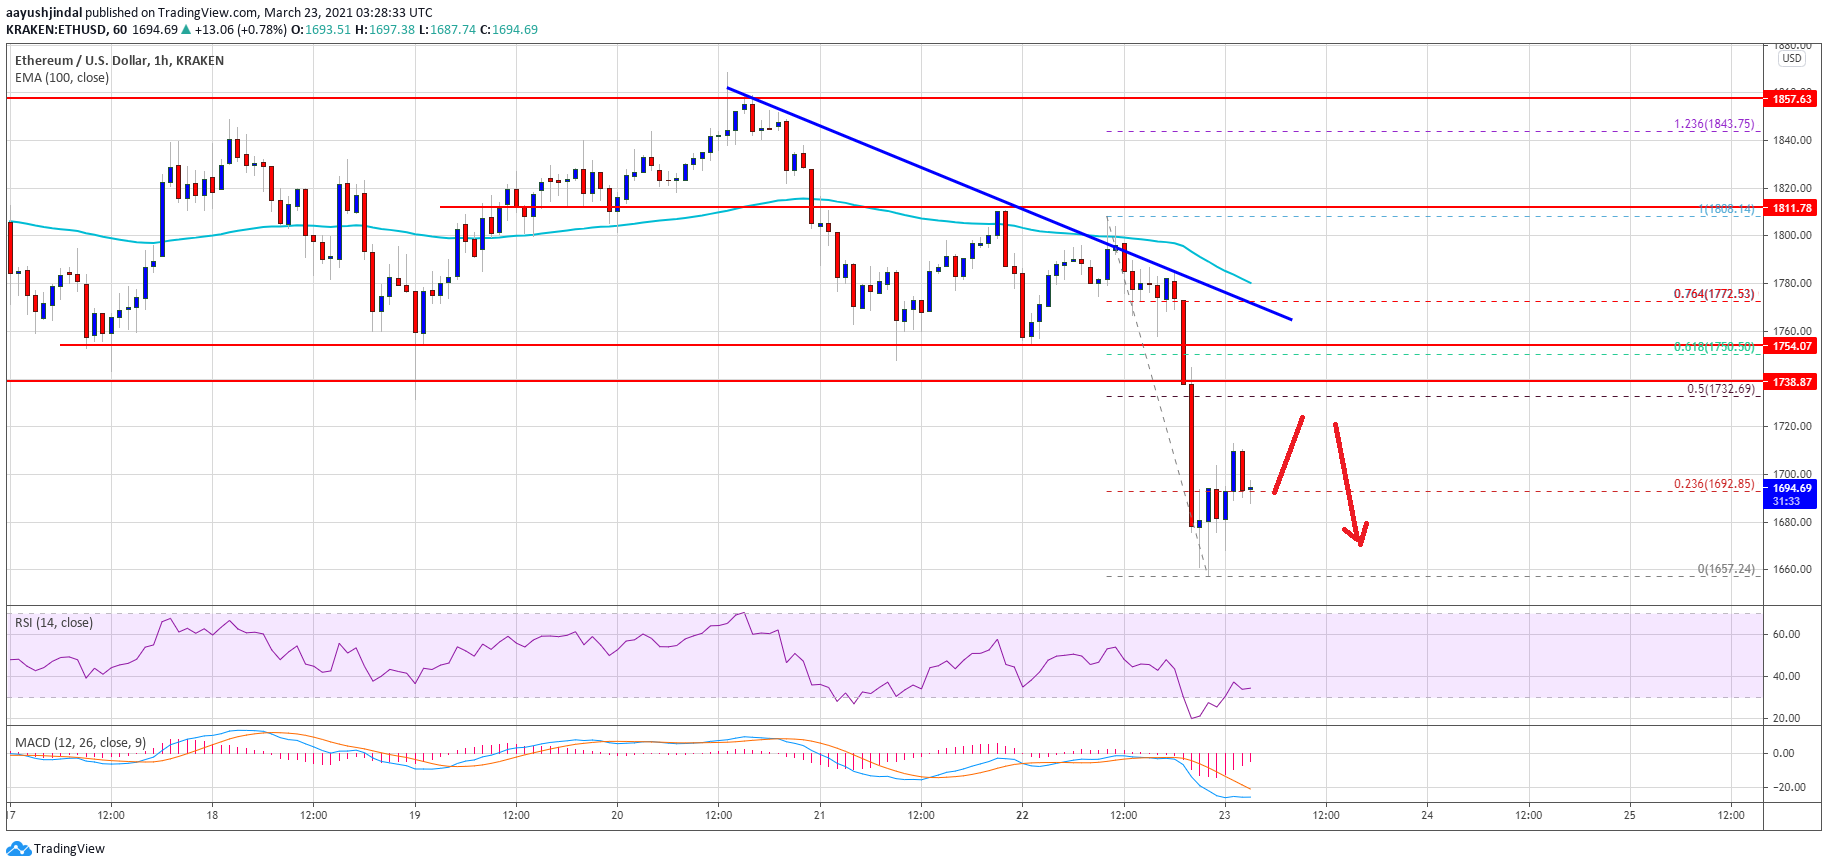
Ethereum broke the major $1,750 and $1,710 support levels against the US Dollar. ETH price is likely to continue lower below the $1,660 and $1,650 support levels. Ethereum failed to stay above the key $1,750 and $1,710 support levels. The price is currently trading well below $1,710 and the 100 hourly simple moving average. There […]
Yesterday afternoon, shortly before the markets closed in the UK, we published our bitcoin price watch piece highlighting the levels we would be keeping an eye on in the BTCUSD as the bitcoin price matured overnight. We've seen some considerable movement throughout this maturity, and our parameters - in terms of levels to watch - have changed. With this said, what happened overnight, and what will action around particular levels tells about a potential intraday bias as we head into a fresh day of trading? Take a quick look at the chart. As you can see, action in the bitcoin price overnight....