
TA: Bitcoin Spikes Higher, Why Bulls Could Aim Larger Increase To $52K
Bitcoin started an upside correction above the $48,000 resistance zone against the US Dollar. BTC could gain pace if there is a close above the $50,000 level. Bitcoin started a decent increase above the $47,500 and $48,000 levels. The price is now trading above $48,500 and the 100 hourly simple moving average. There was a break above a connecting bearish trend line with resistance near $48,200 on the hourly chart of the BTC/USD pair (data feed from Kraken). The pair could accelerate higher if there is a close above the $50,000 resistance zone. Bitcoin Price Starts Recovery Bitcoin price....
Related News
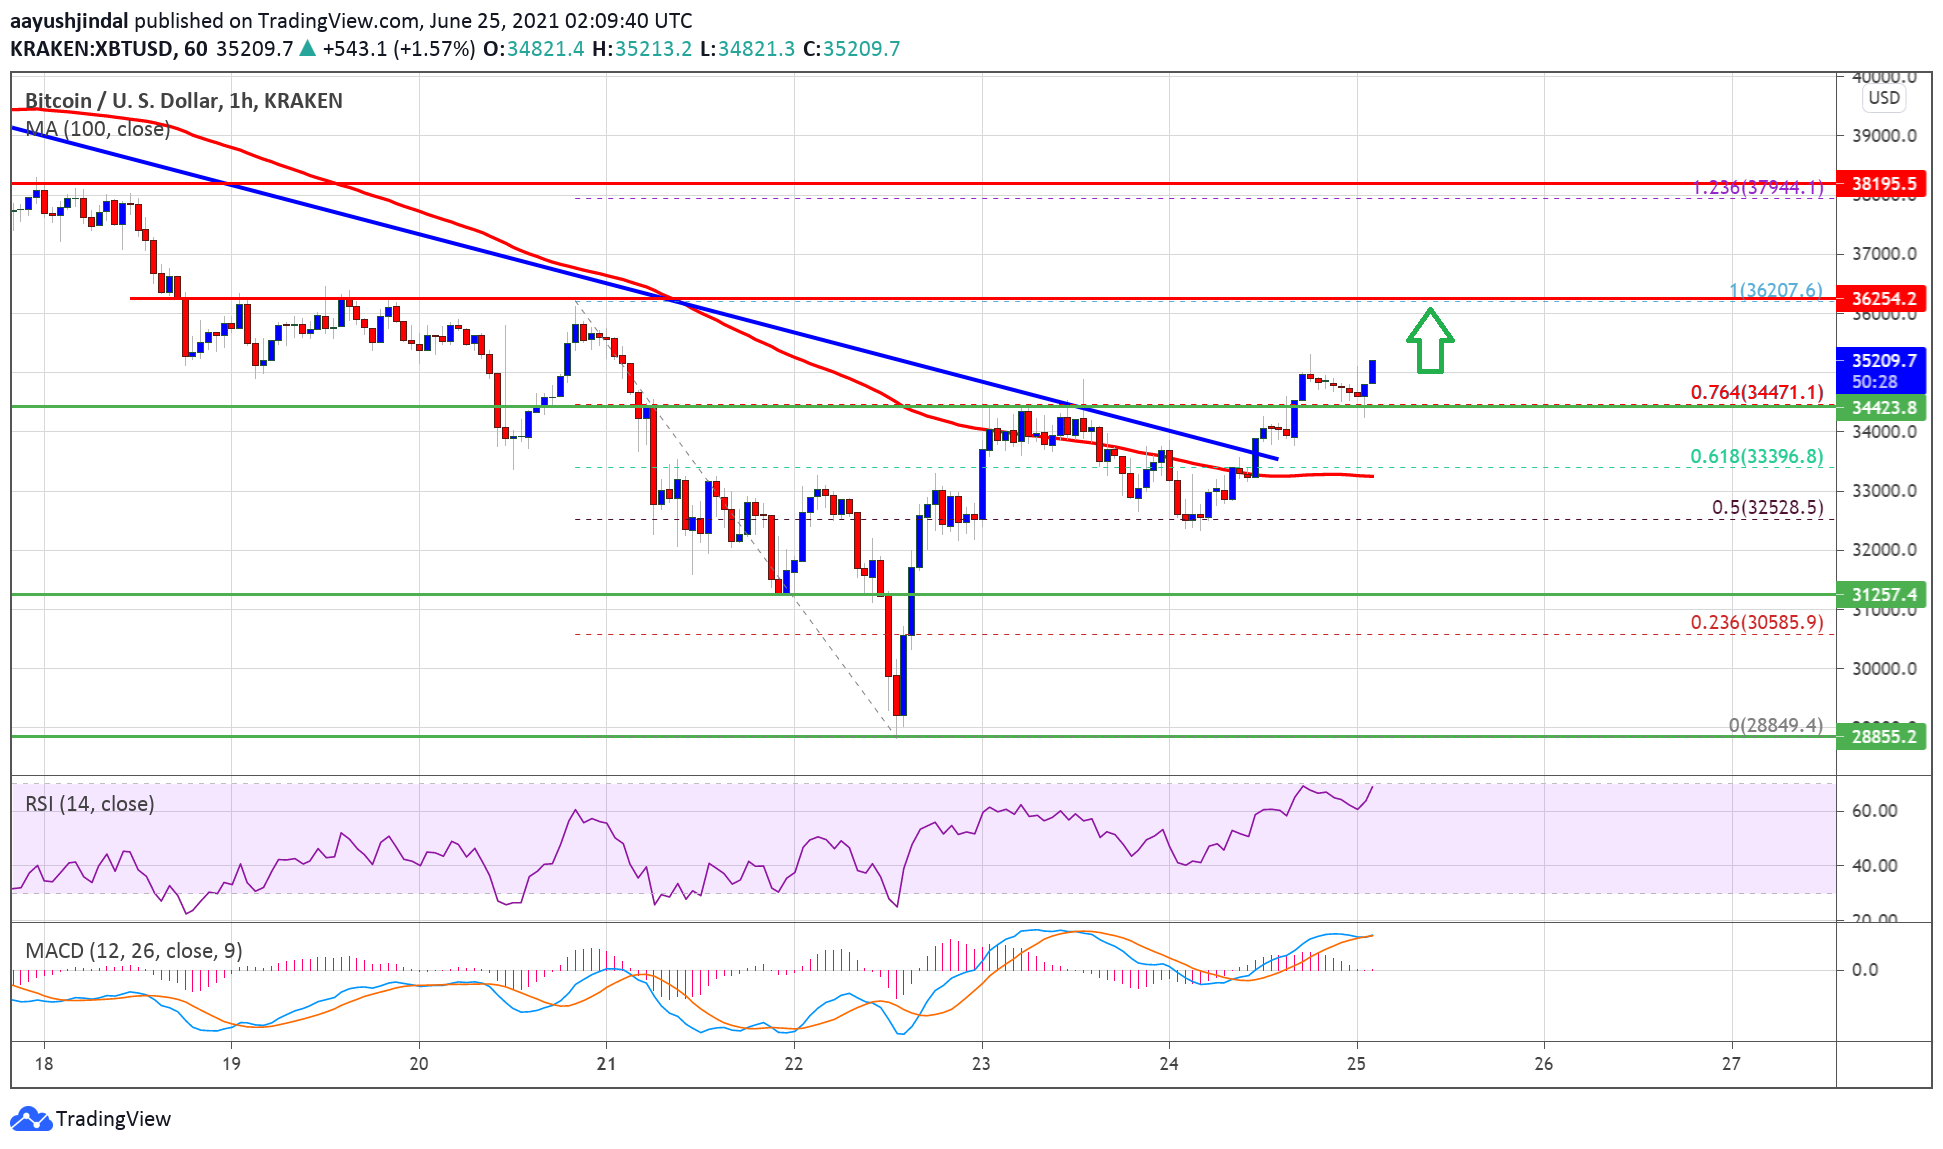
Bitcoin price regained strength for a fresh increase and it broke $35,000 against the US Dollar. BTC is likely to accelerate higher towards $36,500 or even $37,000. Bitcoin started a fresh increase above the $34,000 and $35,000 resistance levels. The price is now trading nicely above $34,000 and the 100 hourly simple moving average. There […]

Solana found support near the $205 zone. SOL price is now consolidating gains above $220 and might soon aim for more gains above $232. SOL price started a fresh increase above $215 and $220 against the US Dollar. The price is now trading above $225 and the 100-hourly simple moving average. There is a connecting bullish trend line forming with support at $227 on the hourly chart of the SOL/USD pair (data source from Kraken). The price could start another increase if the bulls clear $235 and $242. Solana Price Aims Higher Solana price remained supported above the $215 pivot level and....
Bitcoin price started a fresh increase and cleared the $80,500 zone. BTC is consolidating and might aim for more gains above the $82,000 level. Bitcoin managed to stay above $78,800 and started a fresh increase. The price is trading above $80,500 and the 100 hourly simple moving average. There was a break above a bearish trend line with resistance at $80,650 on the hourly chart of the BTC/USD pair (data feed from Kraken). The pair might extend gains if it stays above the $80,500 and $80,000 levels. Bitcoin Price Regains Strength Bitcoin price found support near $78,800 and started a fresh....
Ethereum is gaining pace above the $3,950 zone against the US Dollar. ETH price is showing positive signs and the bulls might aim a larger increase above $4,100 Ethereum started a fresh increase and even climbed above the $4,000 resistance zone. The price is trading above $4,000 and the 100 hourly simple moving average. There was a break above a major bearish trend line with resistance near $3,960 on the hourly chart of ETH/USD (data feed via Kraken). The pair could accelerate higher above the $4,050 and $4,080 resistance levels. Ethereum Price Gains Pace Ethereum started a steady recovery....

Ethereum price seems to have its sights set higher after breaking out of a descending triangle on its 4-hour chart. Technical indicators are also supporting further gains. Ethereum price had previously consolidated inside a descending triangle pattern, forming lower highs and finding support at 0.00250. At the moment, ethereum price is testing the near-term resistance at the 0.00300 level, waiting for more bulls for another leg higher. An upside break past this level could take it up to the next area of interest at 0.00330-0.00350 then onwards to the larger triangle highs at 0.00400.