
XRP Price Dips Under Crucial Support, Putting Spotlight on Lower Price Targets
XRP price started a fresh decline below $2.150. The price is now struggling and faces resistance near the $2.10 pivot level. XRP price started a fresh decline below the $2.150 zone. The price is now trading below $2.120 and the 100-hourly Simple Moving Average. There was a break below a key bullish trend line with support at $2.180 on the hourly chart of the XRP/USD pair (data source from Kraken). The pair could continue to move down if it settles below $2.00. XRP Price Dips Again XRP price attempted a recovery wave above $2.150 but failed to continue higher, like Bitcoin and Ethereum. The....
Related News

XRP’s price action within the past seven days has been limited to a trading range as investors look to recover the losses they incurred at the beginning of February. This range is a consequence of the current indecisiveness on the XRP price. However, popular crypto analyst EGRAG CRYPTO has provided a detailed breakdown of XRP’s price trajectory from here. Particularly, the analyst highlighted crucial support and resistance levels that could determine XRP’s movement at each stage. XRP’s Lower Price Targets Indicate Key Support Levels Sharing his insights on X, EGRAG CRYPTO....
Dogecoin is at a critical point, with its price hovering around $0.16. Traders are watching closely, as this support level could be the deciding factor in whether the meme coin takes off or tumbles further. If history is any guide, maintaining this level could spark a rally, while losing it may bring more pain. Related Reading: Bitcoin’s ‘Ugly Start’ – Weekend Sell-Off Pushes Price Near $80K Dogecoin: Key Level To Watch The $0.16 support level is not just a random number—it has been a crucial zone for Dogecoin. If it stays above this mark, there’s a strong chance of a rebound. Past price....
Ethereum price continued to gain traction against the US Dollar, and it looks like the idea of buying dips may still work in the short term. Key Highlights. Ethereum price surged higher against the US dollar and posted healthy gains during the past 24 hours. My yesterday’s idea of buying worked and it you entered a trade, then it’s time to take profits if not already. A new bullish trend line is formed on the hourly chart (data feed via SimpleFX) of ETH/USD, which can now act as a support area on the downside. Ethereum Price Buy. Ethereum price ETH climbed further higher against US Dollar,....
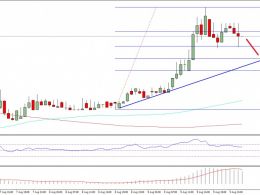
Key Highlights. Bitcoin prices surged higher this past week and briefly traded close to the ¥3000-3100 resistance area. The price is currently correcting lower and approaching towards a major support trend line on the 4-hour chart (data feed from BTCChina). Buying dips may be a good idea if the price trades near the ¥2600 support area. Bitcoin's price is following a nice bullish trend, and it looks like there are chances of more gains in the near term as long as the price is above the 100 MA. Buy Dips? Bitcoin prices rocketed higher this past week, and spiked above the ¥3000 resistance....
Bitcoin broke the $65,000 resistance and traded to a new all-time high against the US Dollar. BTC is correcting gains, but dips could remain attractive near $63,000. Bitcoin gained pace above the $65,000 and $65,500 resistance levels. The price is now trading above $63,000 and the 100 hourly simple moving average. There is a crucial bullish trend line forming with support near $63,000 on the hourly chart of the BTC/USD pair (data feed from Kraken). The pair is correcting gains, but dips might remain limited below $62,000 in the near term. Bitcoin Price Remains In Uptrend Bitcoin price....