
Wedge Breakout Or False Alarm? Ethereum Faces Its Biggest Support Test Yet
Ethereum’s price action is at a decisive point after breaking out of a rising wedge pattern. While the move initially fueled optimism for higher targets, the retest of a critical support zone will determine whether this breakout holds or fades into a false alarm. With the $3,900–$4,100 range now acting as the line in the sand, Ethereum faces one of its most important tests yet. ETH Breaks Rising Wedge: Key Retest In Play According to a recent post by crypto analyst The Boss on X, Ethereum’s weekly chart was previously showing a rising wedge formation. This technical pattern is often viewed....
Related News

Ethereum finds itself at a crossroads after tapping the $3,800 liquidity level and bouncing back, only to stall below the key $4,060 region. With momentum hanging in the balance, traders are questioning whether this pause is simply a fakeout before a recovery or the start of a deeper move toward the $3,600 support level. Struggling Below $4,060: Key Support Yet To Be Reclaimed Ted, a well-followed crypto analyst, recently shared his insights on Ethereum’s latest price action in a post on X. According to the expert, ETH successfully tapped into the $3,800 liquidity level, a move he had....
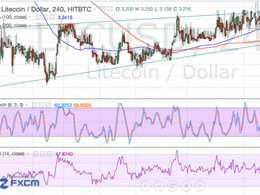
Litecoin Price Key Highlights. Litecoin price is currently stuck inside a rising wedge pattern on its 4-hour chart, indicating a slight trend higher with a bit of consolidation. Price found resistance at the area of interest around the middle of the wedge and went for a test of support. Litecoin price bounced off the wedge support and may be in for a stronger climb up to the resistance at $3.400. Potential Breakout Soon. For now, the 100 SMA is above the 200 SMA, which suggests that the uptrend could carry on. However, stochastic and RSI are both heading down from the overbought zone,....

Ethereum Price Key Highlights. Ethereum price has been trading inside a rising wedge consolidation pattern for quite some time and has finally broken out. This type of chart pattern is usually indicative of a longer-term drop, as buyers are able to make higher lows but unable to sustain higher highs. Ethereum price seems to have picked a direction to go, as it made a strong break below the wedge support at 0.00290. Ethereum price might target the rising wedge lows at 0.00240 but the 100 SMA appears to be holding as a dynamic support level for now. Sustained selling pressure could lead to a....

Ethereum Price Key Highlights. Ethereum price is gradually trending higher but there are still some signs of consolidation, creating a rising wedge pattern on its 1-hour time frame. Price is currently hovering near the wedge support, as buyers and sellers try to decide whether a bounce or a break is in order. Ethereum price is still picking a direction, with a slight bias to the upside, as bitcoin price is also under a bit of selling pressure. Potential Resistance at 0.00300? A bounce off the wedge support around 0.00260 could lead to a move up to the top of the pattern just past the....

Ethereum Price Key Highlights. Ethereum price is still slowly climbing, transitioning into a rising wedge formation from an earlier ascending channel. Price bounced off the mid-channel area of interest as predicted in an earlier article, reflecting increased bullish pressure. With the consolidation getting tighter and ethereum price approaching the peak of the wedge, a breakout in either direction is imminent. Waiting for Bitcoin Breakout? Bitcoin is also stuck in a consolidation pattern, as traders are probably on the lookout for more catalysts. This has kept ethereum price in....