
Ethereum Price Intraday Analysis for 19/11/2015 - Finally Breaking Out!
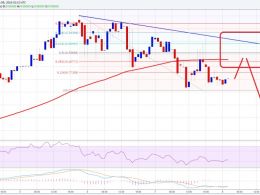
Ethereum Price Key Highlights. Ethereum price has been trading inside a rising wedge consolidation pattern for quite some time and has finally broken out. This type of chart pattern is usually indicative of a longer-term drop, as buyers are able to make higher lows but unable to sustain higher highs. Ethereum price seems to have picked a direction to go, as it made a strong break below the wedge support at 0.00290. Ethereum price might target the rising wedge lows at 0.00240 but the 100 SMA appears to be holding as a dynamic support level for now. Sustained selling pressure could lead to a....
Related News
Ethereum price traded down finally and also moved back below $10.0. It looks like there is a chance of a minor correction moving ahead. Intraday Support Level can be $9.07. Intraday Resistance Level may be $10.5. Ethereum price as highlighted yesterday made a new high of $11.98 where it found sellers and started to move down. The price also traded below the $10.0 level, which is a sign that bulls stepped back and failed to prevent losses. If the bears manage to gain strength, then there is a chance of more losses in the near term.
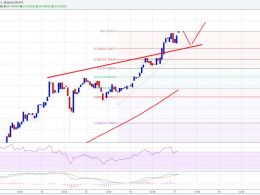
Ethereum price finally broke $20.0, which is a sign that the ETH bulls are in control. Can it continue to trade higher or should we trade safe? Key Highlights. Ethereum price finally tested and broke my much anticipated target of $20.0 against the US Dollar. During my last couple of analysis, I highlighted that the price may test or even break the $20.0 resistance level in the short term. There was a resistance trend line on the hourly chart (data feed via Kraken) of ETH/USD, which was cleared recently to open the doors for more upsides. Ethereum Price Support. Ethereum price ETH continued....
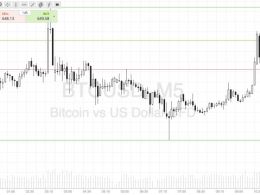
Here's a look at what we are focusing on in the bitcoin price this morning. It’s taken us a little longer than expected, but we’ve finally got some decent momentum in the bitcoin price. In yesterday’s analysis we highlighted the fact that – despite the fundamentals suggesting we might see some action – price had stayed relatively flat across the last week or so. This isn’t necessarily a bad thing, but it doesn’t make for particularly interesting intraday trading. Well, last night, price finally broke through resistance and we managed to get in and out for a quick scalp profit. It looks as....

Ethereum price has seen a lot of decline after hitting an all-time high above $4,900. This move saw the bears push the price back, resisting the campaign to hit $5,000. So far, the bears have remained in control, and it seems that this will be the case for a while, with technicals pointing toward a possible 10% crash that would send the price toward $4,000 again. Why Ethereum Price Is At Risk In an update to a previous analysis, Klejdi Cuni has forecasted a further decline for the Ethereum price, with bearish indicators being more prominent. The previous prediction, shared over the....
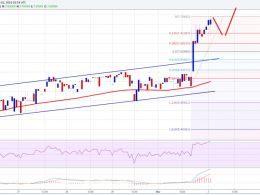
Ethereum price gained heavily once again. It looks like there is a chance of more upsides if the bulls remain in control. Intraday Support Level can be $7.10. Intraday Resistance Level may be $7.75. Ethereum price consolidated for a brief period during the past couple of sessions, and finally broke higher. I highlighted a contracting triangle pattern on the hourly chart (data feed via Kraken) yesterday and suggested to wait for a break to enter a trade. The price did move higher and breached a major resistance area of $6.60. After the break, there was a nice upside move that took the price....