
Bitcoin Price Faces Big Test – Resistance Could Decide Next Move
Bitcoin price is moving higher above $116,500. BTC is now facing hurdles and might gain bullish momentum if it clears the $117,250 resistance zone. Bitcoin started a fresh increase above the $116,200 zone. The price is trading below $116,200 and the 100 hourly Simple moving average. There is a key bullish trend line forming with support at $115,500 on the hourly chart of the BTC/USD pair (data feed from Kraken). The pair might start another increase if it clears the $117,250 zone. Bitcoin Price Faces Key Hurdle Bitcoin price started a fresh upward wave above the $115,500 zone. BTC managed....
Related News
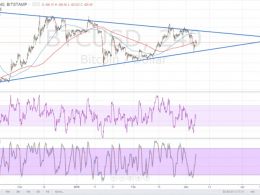
Bitcoin price just came off a test of the triangle support and might be due for another move towards resistance. The 100 SMA is above the 200 SMA, signaling that the path of least resistance is to the upside. Stochastic is on the move up, which also confirms that buyers are in control of price action for now, likely pushing for a test of the triangle top around $420-430. RSI is also heading north so price might follow suit. Stronger bullish pressure might even lead to an upside break of the triangle resistance and a prolonged uptrend for bitcoin price. In that case, price could resume its....

Bitcoin attempted a move towards $45,000 but failed against the US Dollar. BTC is correcting lower, but dips might be limited below $42,800. Bitcoin extended increase above $44,000 before it faced sellers. The price is trading above $43,500 and the 100 hourly simple moving average. There was a break below a short-term rising channel with support near $44,200 on the hourly chart of the BTC/USD pair (data feed from Kraken). The pair could drop to $43,000 or $42,800, where the bulls might take a stand. Bitcoin Price Faces Resistance Bitcoin price remained supported and extended increase above....
XRP price started a fresh decline below the $2.00 zone. The price is now correcting losses and faces resistance near the $2.050 level. XRP price started a fresh decline below the $2.050 zone. The price is now trading below $2.020 and the 100-hourly Simple Moving Average. There is a key bearish trend line forming with resistance at $2.020 on the hourly chart of the XRP/USD pair (data source from Kraken). The pair might start a fresh increase if there is a close above the $2.050 resistance zone. XRP Price Faces Resistance XRP price reacted to the downside below the $2.120 support zone, like....
Bitcoin price is attempting to recover from $112,000. BTC is back above $113,200 but faces many hurdles on the way up to $118,000. Bitcoin started a recovery wave above the $112,500 zone. The price is trading below $115,000 and the 100 hourly Simple moving average. There is a key bearish trend line forming with resistance at $113,500 on the hourly chart of the BTC/USD pair (data feed from Kraken). The pair might start another increase if it clears the $115,000 resistance zone. Bitcoin Price Faces Resistance Bitcoin price started a fresh decline after a close below the $115,000 level. BTC....
Solana started a fresh increase from the $194 zone. SOL price is now recovering higher and faces a heavy resistance near $212. SOL price started a recovery wave after it tested the $194 zone against the US Dollar. The price is now trading above $200 and the 100-hourly simple moving average. There was a break below a connecting bullish trend line with support at $207 on the hourly chart of the SOL/USD pair (data source from Kraken). The pair could start a fresh increase if it clears the $212 resistance zone. Solana Price Faces Resistance Solana price started a decent increase from the....