
XRP Price Reversal Gathers Speed, Downside Pressure Intensifies
XRP price failed to stay above $1.3950 and started a downside correction. The price is now holding the $1.3680 support but is at risk of more losses. XRP price started a downside correction and declined below $1.4050. The price is now trading near $1.3720 and the 100-hourly Simple Moving Average. There is a new bearish trend line forming with resistance at $1.3910 on the hourly chart of the XRP/USD pair (data source from Kraken). The pair could start another increase if it stays above $1.3680. XRP Price Corrects Gains XRP price failed to stay above $1.4120 and started a downside....
Related News

Bitcoin continues to struggle below the $70,000 threshold, reflecting persistent market pressure after weeks of volatility and weak recovery attempts. Despite occasional rebounds from the $60,000 region, upside momentum remains limited, suggesting that demand has yet to return in a meaningful way. Market sentiment has shifted toward caution, with traders increasingly focused on downside risk […]
Bitcoin continues to trade below the $100,000 mark, struggling to find direction amid growing indecision and persistent selling pressure. After briefly dipping toward $95,000, the market is attempting to hold this key support level as sentiment remains fragile. Traders and investors are closely watching whether Bitcoin can stabilize here or if further downside is imminent. […]

Bitcoin’s recent price action suggests a cooling phase after its failed attempt to secure a close above the $123,000–$124,000 all-time high zone. While short-term retracement appears likely, the broader market structure remains bullish. This correction could serve as a healthy reset before Bitcoin gathers momentum for its next major wave, with $150,000 standing as the next target. Heatmap Reveals Key Gaps In Bitcoin’s Support Levels ZYN, a prominent crypto analyst, recently posted an update on X highlighting a key observation from Bitcoin’s cost basis heatmap. The analyst noted that....
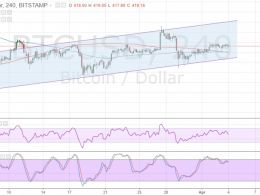
Bitcoin price is slowly crawling higher with the rising channel still intact, but a downside break and reversal might be looming. The 100 SMA is below the 200 SMA for now so the path of least resistance might be to the downside. However, an upward crossover appears to be taking place to show a pickup in bullish strength. If so, bitcoin price could make a stronger attempt to rally towards the channel resistance. Stochastic is making its way down from the overbought level to show a return in bearish pressure. RSI is also heading south so bitcoin price might follow suit. In that case, price....

The profit booking which began since Bitcoin hit a high of $278 continues. Bitcoin price has dropped 2.37% since yesterday to be trading at $264.55. With this decline, the cryptocurrency also breached a near-term support of $267 and I believe the next downside target is $260. The 240-minute BTC-USD price chart above indicates that Bitcoin may face more pressure as technical indicators as well as the chart structure have turned bearish. Bitcoin Chart Structure - A simple glance at the above chart would reveal a Head and Shoulders pattern - a bearish pattern which indicates a trend reversal.....