Bitcoin Price Technical Analysis for 8/7/2015 - More Downside Possible
The profit booking which began since Bitcoin hit a high of $278 continues. Bitcoin price has dropped 2.37% since yesterday to be trading at $264.55. With this decline, the cryptocurrency also breached a near-term support of $267 and I believe the next downside target is $260. The 240-minute BTC-USD price chart above indicates that Bitcoin may face more pressure as technical indicators as well as the chart structure have turned bearish. Bitcoin Chart Structure - A simple glance at the above chart would reveal a Head and Shoulders pattern - a bearish pattern which indicates a trend reversal.....
Related News
Bitcoin Price Key Highlights. Just a few weeks after breaking below a bearish pennant on its 4-hour time frame, bitcoin price has formed yet another continuation pattern. Bitcoin price is still stuck inside the triangle or flag formation, with the path of least resistance to the downside since a downtrend is ongoing. Bitcoin price could be due for another break lower, potentially sending it down towards support at the $300 level. Mixed Technical Signals. Technical indicators are giving mixed signals though, which means that a downside break isn't guaranteed yet. For one, the 100 SMA is....
Ethereum has dropped 1.5 percent to 0.00197BTC, in line with our bearish expectations. We iterated our short view in the previous technical analysis titled Bitcoin-fueled bounce fades away. The price action in the past 24 hours has been strongly bearish and threatens a further 4% drop in the pair. Chart Structure – The underlying weakness in ETH-XBT forced the pair below the 20 4-h SMA (we discussed this possibility in the previous price analysis). The bulls did attempt to reverse the losses but failed miserably as the bears used the breached moving average as an offloading level. The pair....
In my previous analysis titled More Downside Possible, I had mentioned of a bearish Head and Shoulders Pattern which had set the downside Bitcoin target at $260. Bitcoin did fall to $263 before rising again to challenge the broken neckline support and hitting an intraday high of $273. Bitcoin can be seen trading up 1.19% at $267.69. The latest price action in Bitcoin has made it incredibly difficult for an analyst to tell a direction. The technical indicators overlaid on the 240-minute BTC-USD price chart also fail to provide any significant clues to the future course of action. Bitcoin....
Bitcoin has dropped from the strong resistance level of $227 following the announcement of the BitLicense regulations. After erasing the gains, Bitcoin was trading at $225.20 previously while today it is trading down 0.86% at $223.27. The question to be asked now is: Is there more downside left given that the biggest trigger has been digested by the market? I believe the answer is a Yes! Technical analysis of the 240-minute BTC-USD price chart confirms my bearish stance on Bitcoin. Bitcoin Chart Structure - Bulls' first attempt at keeping up the price has been easily thwarted by the bears....
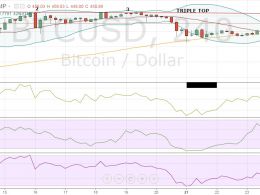
The Christmas isn’t turning out to be merry for Bitcoin. The cryptocurrency is struggling near the overhead resistance of $465. It is now trading 1.28% lower at $450.89, raising concerns that the market participants might pull out their funds in the holiday season. As a result, several technical indicators are also showing declines. We advised in the previous Bitcoin price technical analysis Target Achieved that traders should book at least partial profits in their long positions. And for today’s analysis, we will again be using the 4-h BTC-USD price chart from BITSTAMP.


