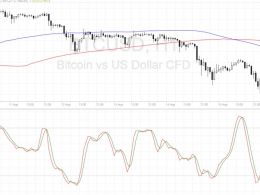
Bitcoin Price Technical Analysis for 9/7/2015 - Neckline Resistance Holds
In my previous analysis titled More Downside Possible, I had mentioned of a bearish Head and Shoulders Pattern which had set the downside Bitcoin target at $260. Bitcoin did fall to $263 before rising again to challenge the broken neckline support and hitting an intraday high of $273. Bitcoin can be seen trading up 1.19% at $267.69. The latest price action in Bitcoin has made it incredibly difficult for an analyst to tell a direction. The technical indicators overlaid on the 240-minute BTC-USD price chart also fail to provide any significant clues to the future course of action. Bitcoin....
Related News
Ethereum Price Key Highlights. Ethereum price has been on a downtrend on its longer-term time frames, but it looks like the tides could turn. A double bottom pattern is visible on the 4-hour chart and price is making its way up to test the neckline at 0.0040. Ethereum price could be in for a long-term uptrend if it is able to break past the neckline resistance soon. Technical Indicators In Favor Of the Bulls. The technical indicators on the 4-hour time frame support further gains in ethereum price, as the 100 SMA just crossed above the 200 SMA. This signals that the path of least....
Litecoin has broken above the neckline of the Reverse Head & Shoulders pattern which sets its next target at $1.800. But, the upside breach is not convincing enough; the technical indicators do not display strong optimism and the post-breakout price action fails to inspire confidence to buy. Litecoin is presently consolidating above the neckline at $1.700. A technical analysis of the 240-minute LTC/USD price chart prevents me from buying into this market trap. Litecoin Chart Structure - Even though Litecoin has broken above the neckline level of $1.690, it has not made any significant....
Bitcoin price might be able to resume its drop upon testing the area of interest and drawing more sellers to the mix. Price has previously broken below a double top and an ascending triangle. The broken support at the $420 neckline coincides with the dynamic resistance around the moving averages. In addition, the short-term 100 SMA is below the longer-term 200 SMA, confirming that the path of least resistance is to the downside. If the 100 SMA moves farther below the 200 SMA, bearish momentum could pick up.
UNI needs to break above a key technical resistance level to trigger its 100% bull run scenario. Otherwise, a bear flag awaits a 45% price crash. Uniswap (UNI) market valuation could grow by 100% in the second half of 2022 as it paints a classic bearish reversal pattern.UNI price bullish setupDubbed "inverse head and shoulders (IH&S)," the technical setup takes shape when the price forms three troughs in a row below a common support level (neckline), with the middle one (head) deeper than the other two (shoulders). Additionally, it resolves after the price breaks above the support....
Bitcoin price enjoyed a strong rally recently but could be ready to resume its slide soon if this area of interest holds. Bitcoin Price Key Highlights. Bitcoin price broke above the neckline of the short-term double bottom formation illustrated in the previous article. Price has climbed to the $580 area since and is testing the support turned resistance level. Additional resistance is located around technical inflection points so a return in bearish pressure could be due. Technical Indicators Signals. The 100 SMA is below the longer-term 200 SMA, confirming that the path of least....


