
Bitcoin Price Technical Analysis for 19/01/2016 – Pullback to Double Top Neckline?
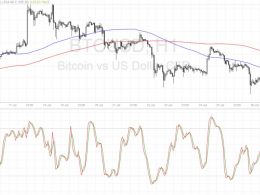
Bitcoin price might be able to resume its drop upon testing the area of interest and drawing more sellers to the mix. Price has previously broken below a double top and an ascending triangle. The broken support at the $420 neckline coincides with the dynamic resistance around the moving averages. In addition, the short-term 100 SMA is below the longer-term 200 SMA, confirming that the path of least resistance is to the downside. If the 100 SMA moves farther below the 200 SMA, bearish momentum could pick up.
Related News
Bitcoin price has formed a double bottom on its 1-hour time frame but has yet to break above the neckline before confirming the reversal. Bitcoin Price Key Highlights. Bitcoin price has been trending lower recently but it looks like sellers are tired from the decline. A small reversal pattern can be seen on the 1-hour time frame, possibly indicating a short-term reversal. Price has failed in its last two attempts to break below the $645 level, creating a double bottom formation. Technical Indicators Signals. The 100 SMA is still below the longer-term 200 SMA so the path of least resistance....
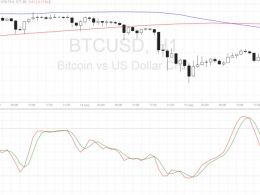
Bitcoin price could be due for more losses once it breaks below the double top neckline around $560. Bitcoin Price Key Highlights. Bitcoin price recently broke below a short-term uptrend formation, signaling that a selloff was in order. On the 4-hour time frame, bitcoin is showing more reversal signals after it failed in its last two attempts to break past the $590 area. A small double top pattern can be observed on this chart, with price still gearing up to test the neckline support. Technical Indicators Signals. The 100 SMA is below the longer-term 200 SMA on this time frame, confirming....
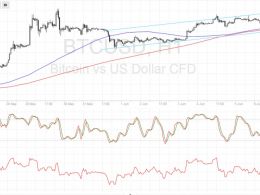
Bitcoin price could be due for a short-term uptrend once it confirms this reversal formation, but technical indicators are suggesting otherwise. Bitcoin Price Key Highlights. Bitcoin price has sold off sharply recently but it looks like bears may be tired from the dive. A small double bottom pattern has emerged after price failed in its last two attempts to break below $565. Price has yet to break past the neckline at $575 before confirming the potential rally. Technical Indicators Signals. The 100 SMA is below the longer-term 200 SMA so the path of least resistance is to the downside. In....
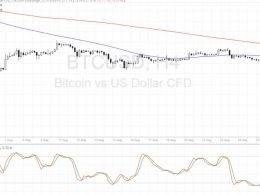
Bitcoin price is at a crossroads, with traders still deciding whether to keep up the uptrend or to start a long-term selloff. Bitcoin Price Key Highlights. Bitcoin price has been trending higher recently, signaling that bulls are trying to push past the latest highs at $600. An ascending channel can be drawn to connect the highs and lows since the start of the month and bitcoin price is testing support. A bounce could lead to another test of $600 but a break lower could complete a longer-term reversal pattern. Technical Indicators Signals. The 100 SMA is above the 200 SMA and is around the....

Ethereum Price Key Highlights. Ethereum price has been on a downtrend on its longer-term time frames, but it looks like the tides could turn. A double bottom pattern is visible on the 4-hour chart and price is making its way up to test the neckline at 0.0040. Ethereum price could be in for a long-term uptrend if it is able to break past the neckline resistance soon. Technical Indicators In Favor Of the Bulls. The technical indicators on the 4-hour time frame support further gains in ethereum price, as the 100 SMA just crossed above the 200 SMA. This signals that the path of least....