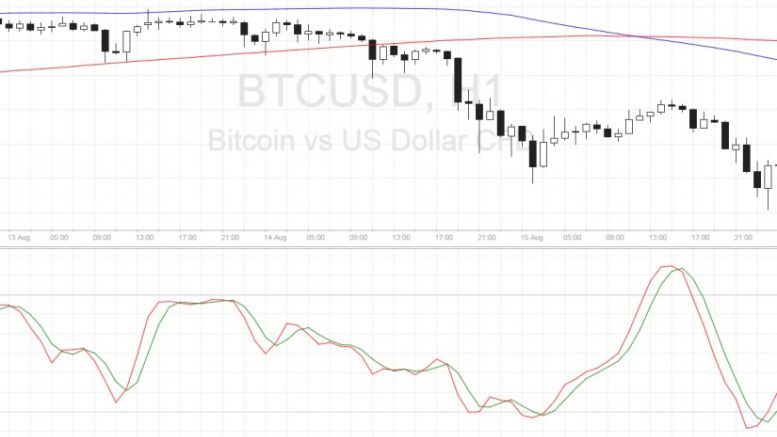
Bitcoin Price Technical Analysis for 08/16/2016 – Short-Term Reversal Pattern?
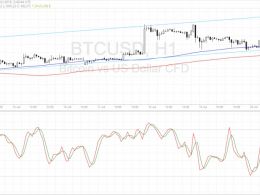
Bitcoin price could be due for a short-term uptrend once it confirms this reversal formation, but technical indicators are suggesting otherwise. Bitcoin Price Key Highlights. Bitcoin price has sold off sharply recently but it looks like bears may be tired from the dive. A small double bottom pattern has emerged after price failed in its last two attempts to break below $565. Price has yet to break past the neckline at $575 before confirming the potential rally. Technical Indicators Signals. The 100 SMA is below the longer-term 200 SMA so the path of least resistance is to the downside. In....
Related News
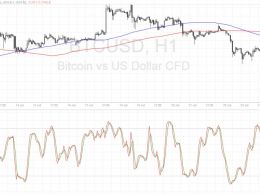
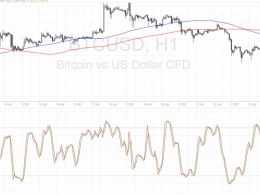
Bitcoin price has formed a head and shoulders pattern on its short-term time frame and is currently testing the neckline. Bitcoin Price Key Highlights. Bitcoin price has recently broken down from a long-term consolidation pattern, signaling an increase in selling pressure. A head and shoulders pattern can be seen on the 1-hour time frame and this is a classic selloff signal. Price is still above the neckline of the reversal formation, though, so it’s still early to confirm if further declines are in order. Technical Indicators Signals. The 100 SMA crossed below the 200 SMA recently, which....
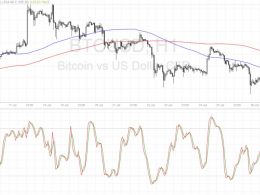
Bitcoin price has formed a double bottom on its 1-hour time frame but has yet to break above the neckline before confirming the reversal. Bitcoin Price Key Highlights. Bitcoin price has been trending lower recently but it looks like sellers are tired from the decline. A small reversal pattern can be seen on the 1-hour time frame, possibly indicating a short-term reversal. Price has failed in its last two attempts to break below the $645 level, creating a double bottom formation. Technical Indicators Signals. The 100 SMA is still below the longer-term 200 SMA so the path of least resistance....
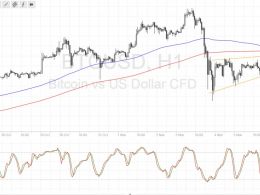
Bitcoin price is consolidating in a rising wedge pattern and the direction of its breakout could set the tone for long-term movement. Bitcoin Price Key Highlights. Bitcoin price recently broke to the downside of its short-term uptrend, signaling a reversal underway. Price is stuck in consolidation for the time being, as traders have been booking profits from the previous drop and waiting for more cues. A break below the rising wedge pattern could confirm that longer-term losses are in the cards. Technical Indicators Signals. The 100 SMA just recently crossed below the longer-term 200 SMA....
Bitcoin price made a downside break from its ascending channel pattern, signaling that a reversal is about to take place. Bitcoin Price Key Highlights. Bitcoin price was previously trading inside an ascending channel before making a break lower, indicating a reversal from the short-term uptrend. Price also broke below the nearby inflection points, which means that sellers are gaining traction. For now, technical indicators are suggesting that the uptrend might still carry on but that could change soon. Technical Indicators Signals. The 100 SMA is still above the longer-term 200 SMA so the....
Bitcoin price seems to be establishing a downtrend after confirming a reversal pattern, and technical indicators support this view. Bitcoin Price Key Highlights. Bitcoin price recently formed a head and shoulders pattern on its short-term time frames, signaling that the recent uptrend may be over. Price has broken below the neckline support, which held as resistance on the retest. This adds confirmation that further losses are possible so it’s time to look at the nearby inflection points and areas of interest for potential targets. Technical Indicators Signals. The 100 SMA is still below....