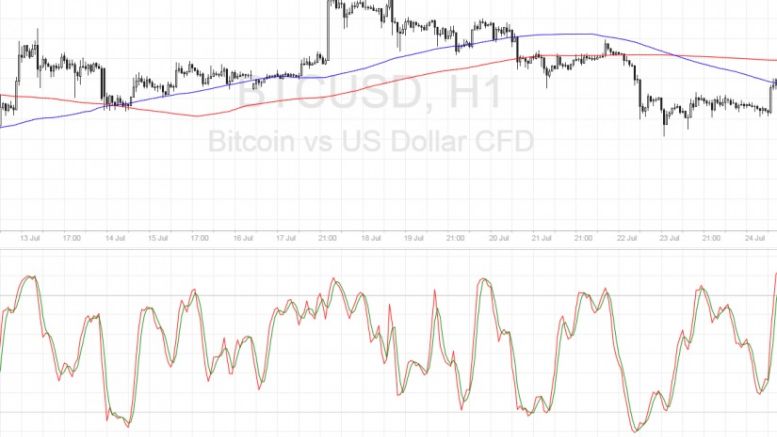
Bitcoin Price Technical Analysis for 07/26/2016 – Reversal Formation Seen!
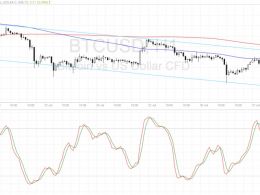
Bitcoin price has formed a head and shoulders pattern on its short-term time frame and is currently testing the neckline. Bitcoin Price Key Highlights. Bitcoin price has recently broken down from a long-term consolidation pattern, signaling an increase in selling pressure. A head and shoulders pattern can be seen on the 1-hour time frame and this is a classic selloff signal. Price is still above the neckline of the reversal formation, though, so it’s still early to confirm if further declines are in order. Technical Indicators Signals. The 100 SMA crossed below the 200 SMA recently, which....
Related News
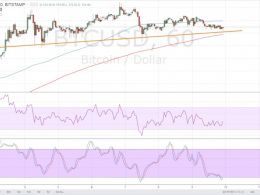
Bitcoin price has formed a double bottom on its 1-hour time frame but has yet to break above the neckline before confirming the reversal. Bitcoin Price Key Highlights. Bitcoin price has been trending lower recently but it looks like sellers are tired from the decline. A small reversal pattern can be seen on the 1-hour time frame, possibly indicating a short-term reversal. Price has failed in its last two attempts to break below the $645 level, creating a double bottom formation. Technical Indicators Signals. The 100 SMA is still below the longer-term 200 SMA so the path of least resistance....
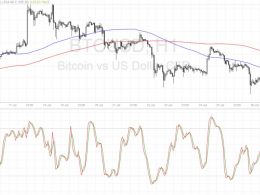
Bitcoin price might be in for a larger drop based on the short-term reversal formation but technical indicators are giving a different signal. Bitcoin Price Key Highlights. Bitcoin price seems to be having trouble sustaining its climb, as it started forming lower highs so far this week. A head and shoulders pattern seems to be forming, indicating a potential reversal if price breaks below the neckline around $570. If that happens, bitcoin price could drop to the next visible support around $540. Technical Indicators Signals. The 100 SMA is above the 200 SMA so the path of least resistance....
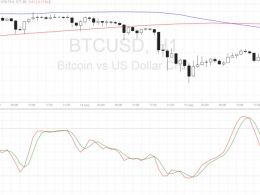
Bitcoin price could be due for a short-term uptrend once it confirms this reversal formation, but technical indicators are suggesting otherwise. Bitcoin Price Key Highlights. Bitcoin price has sold off sharply recently but it looks like bears may be tired from the dive. A small double bottom pattern has emerged after price failed in its last two attempts to break below $565. Price has yet to break past the neckline at $575 before confirming the potential rally. Technical Indicators Signals. The 100 SMA is below the longer-term 200 SMA so the path of least resistance is to the downside. In....
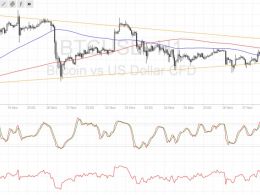
Bitcoin price is hovering at the resistance of the short-term descending channel and could be in for a continuation or reversal. Bitcoin Price Key Highlights. Bitcoin price seems to be establishing a downtrend now that it’s forming a descending channel on its 1-hour time frame. Price is now testing the channel resistance, still deciding whether to make a bounce or a break. Technical indicators seem to be indicating that the selloff could resume but there are also potential arguments for a reversal. Technical Indicators Signals. The 100 SMA is below the longer-term 200 SMA so the path of....
Bitcoin price is still staying inside the consolidation pattern for now but could be ready to break out as it approaches the peak of the formation. Bitcoin Price Key Highlights. Bitcoin price is still stuck in consolidation, moving inside a symmetrical triangle formation as illustrated in an earlier article. Price just bounced off the triangle support after a number of tests and is now making its way to the top. Technical indicators seem to be suggesting that a downside breakout is due. Technical Indicators Signals. The 100 SMA is below the longer-term 200 SMA, which means that the path of....