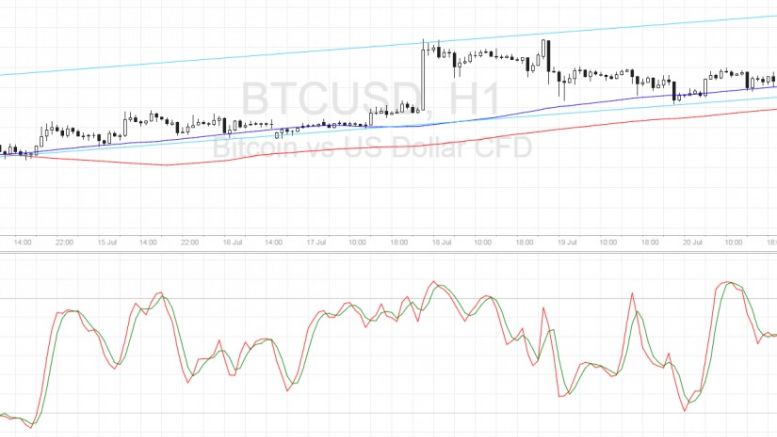
Bitcoin Price Technical Analysis for 07/21/2016 – Bears Gaining Control!
Bitcoin price made a downside break from its ascending channel pattern, signaling that a reversal is about to take place. Bitcoin Price Key Highlights. Bitcoin price was previously trading inside an ascending channel before making a break lower, indicating a reversal from the short-term uptrend. Price also broke below the nearby inflection points, which means that sellers are gaining traction. For now, technical indicators are suggesting that the uptrend might still carry on but that could change soon. Technical Indicators Signals. The 100 SMA is still above the longer-term 200 SMA so the....
Related News
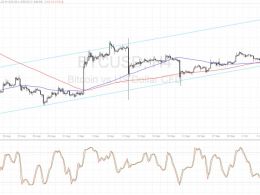
Bitcoin price staged a strong rally to break past the short-term channel top and aim for the longer-term resistance. Bitcoin Price Key Highlights. Bitcoin price enjoyed a boost in volatility yesterday, allowing it to break past the short-term channel resistance. Price is now making its way to the top of a longer-term bullish channel visible on the 4-hour time frame. Technical indicators are also suggesting that buying pressure could be in for the long run. Technical Indicators Signals. The 100 SMA is crossing above the longer-term 200 SMA to show that buyers are taking control of bitcoin....
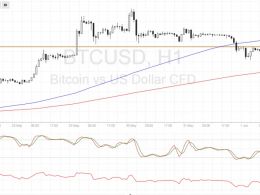
Bitcoin price appears to be correcting from its recent selloff but technical indicators are signaling that a longer-term bounce might be in order. Bitcoin Price Key Highlights. Bitcoin price is pulling up from its recent slide but could be in for more gains if sellers hop in the short-term area of interest. Support at $555 was previously broken and might hold as resistance moving forward. Technical indicators, however, are suggesting that the climb could continue. Technical Indicators Signals. The 100 SMA is safely above the 200 SMA so the path of least resistance is still to the upside.....

Ripple is trying hard to pare the hefty losses incurred in March when the cryptocurrency declined roughly 50% from 0.00005BTC to a low of 0.00002555BTC before closing the month at 0.00003150BTC. But April has been positive for Ripple until now, with the value gaining up to 0.00003423BTC. But will the upmove sustain or are there major hurdles ahead? Let's analyze the 12-hour XRP/BTC price chart to figure out key technical levels and the best trading strategy. Chart Structure - As can be seen, Ripple had been making successive lower tops lending bears the strength to push the prices down....
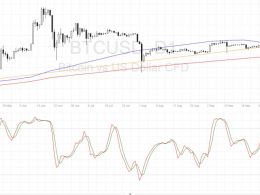
Bitcoin price could be due for more gains after this upside breakout, possibly aiming for the $750 level next. Bitcoin Price Key Highlights. Bitcoin price made a strong upside break of the near-term resistance marked in a previous article. This suggests that bulls are gaining strength and could push price to the next ceiling. At the moment, bitcoin is testing the area of interest at $700, which is a major psychological level. Technical Indicators Signals. The 100 SMA is above the longer-term 200 SMA so the path of least resistance is to the upside, even on this daily chart. However, the....

Bitcoin has been struggling to find any strong momentum throughout the past few days, with bears rapidly gaining control over its price action This trend has not yet been enough to invalidate the cryptocurrency’s technical strength, but it does seem as though it may strike a blow to its macro uptrend Until BTC can enter […]