Bitcoin Price Technical Analysis for 06/02/2016 – Short-Term Area of Interest for Sellers
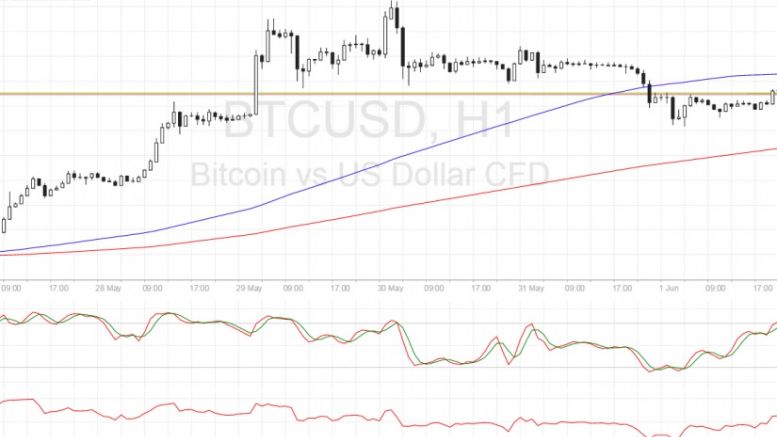
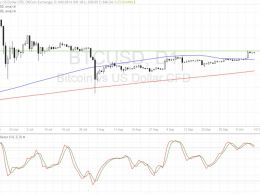
Bitcoin price appears to be correcting from its recent selloff but technical indicators are signaling that a longer-term bounce might be in order. Bitcoin Price Key Highlights. Bitcoin price is pulling up from its recent slide but could be in for more gains if sellers hop in the short-term area of interest. Support at $555 was previously broken and might hold as resistance moving forward. Technical indicators, however, are suggesting that the climb could continue. Technical Indicators Signals. The 100 SMA is safely above the 200 SMA so the path of least resistance is still to the upside.....
Related News

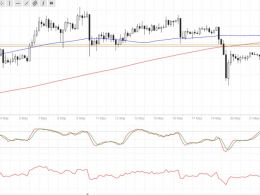
Bitcoin price could be ready to resume its climb now that this area of interest held as support. Bitcoin Price Technical Analysis. Bitcoin price recently made an upside breakout from a near-term resistance around $660. Price has found resistance at the $670 area and has since pulled back to the broken resistance, which appears to have held as support. This signals that bitcoin bulls could be ready to charge once more, although technical indicators are suggesting otherwise. Technical Indicators Signals. The 100 SMA is still below the longer-term 200 SMA so the path of least resistance is to....
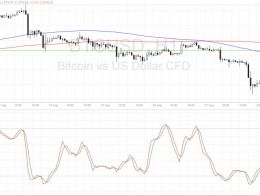
Bitcoin price could be ready to resume its drop if the nearby resistance levels are able to keep gains in check. Bitcoin Price Key Highlights. Bitcoin price recently made a strong downside break, signaling that bears are taking control. Price is making a short-term pullback to the broken near-term support, offering an opportunity for more sellers to hop in. Bitcoin is testing the area of interest at the $448-450 area, which might hold as resistance. Technical Indicators Signals. The 100 SMA is above the 200 SMA for now but the moving averages have inched close together, indicating that a....
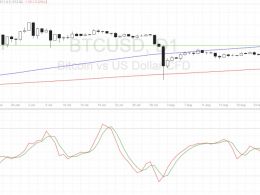
Bitcoin price is trending lower but is making a correction to an area of interest before resuming the selloff. Bitcoin Price Key Highlights. Bitcoin price recently broke below a short-term support area visible on the 1-hour time frame. Price found support around the $565 area before showing signs of pulling back. Bitcoin is now approaching the former support zone around $575, which might now hold as resistance. Technical Indicators Signals. The 100 SMA is below the 200 SMA so the path of least resistance is to the downside, which means that the downtrend could carry on. The 100 SMA is....
Bitcoin price is having trouble breaking past this area of interest visible on the daily time frame as technical indicators are giving mixed signals. Bitcoin Price Key Highlights. Bitcoin price is still stuck in consolidation on its short-term time frames and looking at the daily chart shows why. Price is actually stalling below a former support zone around the $600-620 area, which might continue to hold as resistance. Price is also encountering a bit of a ceiling around its 100 SMA on the longer-term chart. Technical Indicators Signals. The 100 SMA is above the longer-term 200 SMA on this....
Bitcoin price is stalling at a strong area of interest visible on the long-term charts, with indicators suggesting that the resistance could hold. Bitcoin Price Key Highlights. Bitcoin price is consolidating on its short-term time frames and for good reason. Price is actually testing a major area of interest at $645-650, as this held as support in the past and could keep holding as a ceiling. Technical indicators on the longer-term charts are giving mixed signals at the moment. Technical Indicators Signals. The 100 SMA is above the longer-term 200 SMA on the daily time frame, showing that....