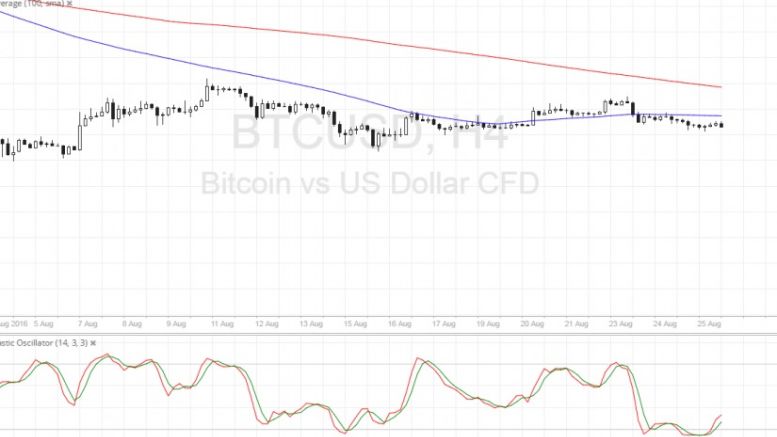
Bitcoin Price Technical Analysis for 08/26/2016 – More Bearish Signals?
Bitcoin price could be due for more losses once it breaks below the double top neckline around $560. Bitcoin Price Key Highlights. Bitcoin price recently broke below a short-term uptrend formation, signaling that a selloff was in order. On the 4-hour time frame, bitcoin is showing more reversal signals after it failed in its last two attempts to break past the $590 area. A small double top pattern can be observed on this chart, with price still gearing up to test the neckline support. Technical Indicators Signals. The 100 SMA is below the longer-term 200 SMA on this time frame, confirming....
Related News
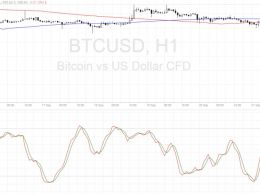
Bitcoin price looks ready continue is dive on a break of this bearish continuation pattern, with technicals signaling further declines. Bitcoin Price Key Highlights. Bitcoin price recently made a sharp break below a short-term consolidation pattern, which means that sellers have taken control. Price seems to have formed a bearish continuation signal as more sellers could take it down. Technical indicators are also confirming that selling pressure is mounting. Technical Indicators Signals. The 100 SMA is moving below the longer-term 200 SMA, confirming that the path of least resistance is....

Technical analysis shows that Dogecoin is looking to break out from a key structure zone near $0.26, which could cause a change in market momentum. This technical outlook comes amidst a bearish week for DOGE, which has seen it breaking below support levels and erasing its gains throughout January. According to a technical analysis of […]
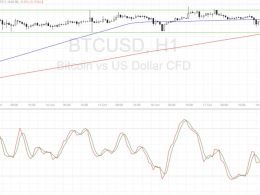
Bitcoin price could continue to consolidate but if a breakout occurs, technicals are favoring a downside move. Bitcoin Price Key Highlights. Bitcoin price is still stuck in its tight range on the short-term time frames, bouncing off support once more. A test of the near-term resistance could be in the cards but technical signals are pointing to a downside break. Buyers seem to be running out of momentum or traders are simply waiting for fresh market catalysts. Technical Indicators Signals. The 100 SMA is above the longer-term 200 SMA for now, which suggests that buyers still may have a bit....

Bitcoin price could be ready to resume its climb now that this area of interest held as support. Bitcoin Price Technical Analysis. Bitcoin price recently made an upside breakout from a near-term resistance around $660. Price has found resistance at the $670 area and has since pulled back to the broken resistance, which appears to have held as support. This signals that bitcoin bulls could be ready to charge once more, although technical indicators are suggesting otherwise. Technical Indicators Signals. The 100 SMA is still below the longer-term 200 SMA so the path of least resistance is to....
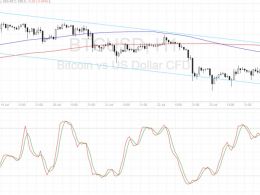
Bitcoin price could be ready to resume its dive since technical signals are indicating that bearish pressure is in play. Bitcoin Price Key Highlights. Bitcoin price recently broke below a triangle consolidation pattern visible on longer-term charts, signaling that sellers are getting the upper hand. Price has since formed a steady downtrend on the 1-hour time frame, moving inside a descending channel pattern. Bitcoin is now testing the channel resistance, with technical indicators suggesting that the selloff could resume. Technical Indicators Signals. The 100 SMA just recently crossed....