Bitcoin Price Technical Analysis for 10/19/2016 – Bearish Pressure Looming
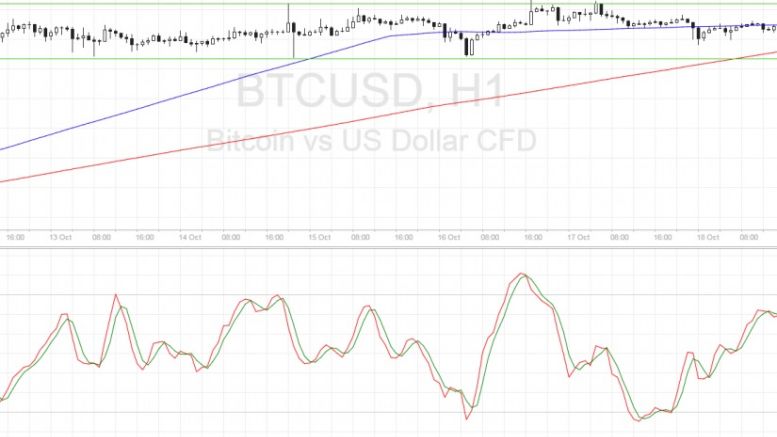
Bitcoin price could continue to consolidate but if a breakout occurs, technicals are favoring a downside move. Bitcoin Price Key Highlights. Bitcoin price is still stuck in its tight range on the short-term time frames, bouncing off support once more. A test of the near-term resistance could be in the cards but technical signals are pointing to a downside break. Buyers seem to be running out of momentum or traders are simply waiting for fresh market catalysts. Technical Indicators Signals. The 100 SMA is above the longer-term 200 SMA for now, which suggests that buyers still may have a bit....
Related News
Litecoin price managed to gain a few bids Intraday as buyers stepped in to prevent any further losses. However, it is hard to say that the bearish pressure is over in the short term. There is a contracting triangle pattern formed on the 30-min chart via the data feed from Bitfinex. The bullish trend line highlighted in yesterday’s post played well and helped the price to move higher. The price is now above the 100 simple moving average (30M chart), which is a positive sign. The price is currently finding sellers near the triangle resistance trend line, which is also coinciding with the....
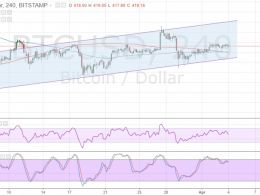
Bitcoin price is slowly crawling higher with the rising channel still intact, but a downside break and reversal might be looming. The 100 SMA is below the 200 SMA for now so the path of least resistance might be to the downside. However, an upward crossover appears to be taking place to show a pickup in bullish strength. If so, bitcoin price could make a stronger attempt to rally towards the channel resistance. Stochastic is making its way down from the overbought level to show a return in bearish pressure. RSI is also heading south so bitcoin price might follow suit. In that case, price....
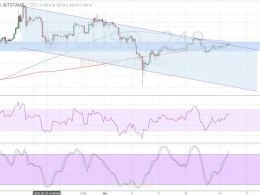
Bitcoin price is testing the channel resistance once more, still deciding whether to make a bounce or a breakout. The 100 SMA is still above the 200 SMA for now with a downward crossover looming. If that happens, more sellers could join the fold and increase bearish pressure enough to lead to a drop until the channel support near $380. RSI is heading north so buyers are still in control but the oscillator is nearing the overbought levels. Stochastic is also heading up and approaching the overbought zone, which could mean that buyers are getting exhausted and ready to let sellers take over.....
Bitcoin price looks ready continue is dive on a break of this bearish continuation pattern, with technicals signaling further declines. Bitcoin Price Key Highlights. Bitcoin price recently made a sharp break below a short-term consolidation pattern, which means that sellers have taken control. Price seems to have formed a bearish continuation signal as more sellers could take it down. Technical indicators are also confirming that selling pressure is mounting. Technical Indicators Signals. The 100 SMA is moving below the longer-term 200 SMA, confirming that the path of least resistance is....
Bitcoin price has exhibited strong bearish momentum but is in the middle of a retracement from its sharp downside move. Bitcoin Price Key Highlights. Bitcoin price made a strong bounce after its sharp drop, reflecting a correction for sellers. Price could pull up to the broken consolidation support or to the moving averages before resuming its drop. The recent hack on a bitcoin exchange in Hong Kong has put downside pressure on prices. Technical Indicators Signals. The 100 SMA is below the longer-term 200 SMA, signifying that the path of least resistance is to the downside and that further....


