Bitcoin Price Technical Analysis for 03/15/2016 – Trying to Break Free?
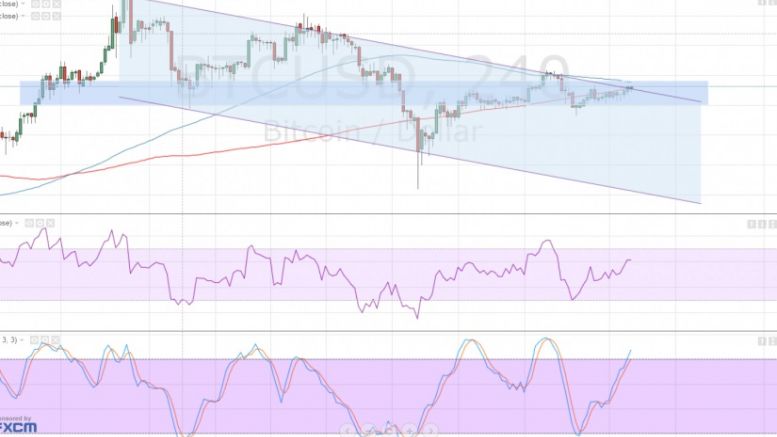
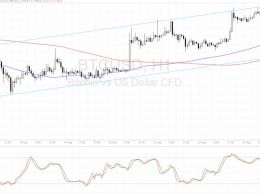
Bitcoin price is testing the channel resistance once more, still deciding whether to make a bounce or a breakout. The 100 SMA is still above the 200 SMA for now with a downward crossover looming. If that happens, more sellers could join the fold and increase bearish pressure enough to lead to a drop until the channel support near $380. RSI is heading north so buyers are still in control but the oscillator is nearing the overbought levels. Stochastic is also heading up and approaching the overbought zone, which could mean that buyers are getting exhausted and ready to let sellers take over.....
Related News
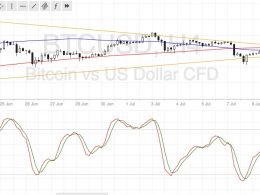
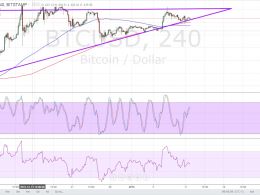
Bitcoin price could be due for a strong break out of its consolidation pattern, but traders still seem to be undecided which way to push. Bitcoin Price Technical Analysis. Bitcoin price is still stuck in its consolidation pattern visible on the 4-hour time frame. Price is already at the peak of the symmetrical triangle formation, which means that a breakout could take place anytime now. Technical indicators and market sentiment appear to be hinting at a downside break. Technical Indicators Signals. The 100 SMA is below the 200 SMA so the path of least resistance is to the downside. A....
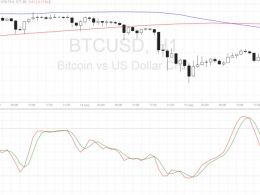
Bitcoin price could be due for a short-term uptrend once it confirms this reversal formation, but technical indicators are suggesting otherwise. Bitcoin Price Key Highlights. Bitcoin price has sold off sharply recently but it looks like bears may be tired from the dive. A small double bottom pattern has emerged after price failed in its last two attempts to break below $565. Price has yet to break past the neckline at $575 before confirming the potential rally. Technical Indicators Signals. The 100 SMA is below the longer-term 200 SMA so the path of least resistance is to the downside. In....
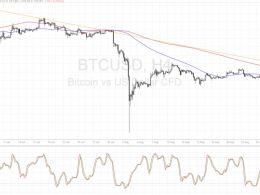
Bitcoin price is still deciding whether to bounce from or break above the descending trend line, depending on how U.S. data turns out. Bitcoin Price Key Highlights. Bitcoin price is still in a downtrend on its longer-term time frames and today’s market catalyst could allow it to resume its selloff. Price has yet to test the descending trend line connecting the highs of price action on the 4-hour chart. Technical indicators seem to be hinting that an upside breakout is possible. Technical Indicators Signals. The 100 SMA is below the longer-term 200 SMA so the path of least resistance could....
Bitcoin price is testing the ascending channel support, still deciding whether to resume the uptrend or break lower. Bitcoin Price Key Highlights. Bitcoin price is still trending higher, moving inside the ascending channel visible on its 1-hour time frame. As illustrated in the earlier article, price made its way back to the channel support after getting rejected on its test of resistance. Support around $580 seems to be holding so far and technical indicators are suggesting that the climb could continue. Technical Indicators Signals. The 100 SMA is above the longer-term 200 SMA, hinting....
Bitcoin price is sitting at the bottom of the long-term ascending triangle, still deciding whether to make a bounce or a break. RSI and moving averages are hinting at a break while stochastic is suggesting a bounce. To figure out where bitcoin price could be headed next, let’s turn to the technical indicators. The moving averages are showing a downward crossover at the moment, with the shorter-term 100 SMA below the longer-term 200 SMA. This indicates that the path of least resistance might be to the downside, favoring further losses. If a break below the triangle support is seen, bitcoin....