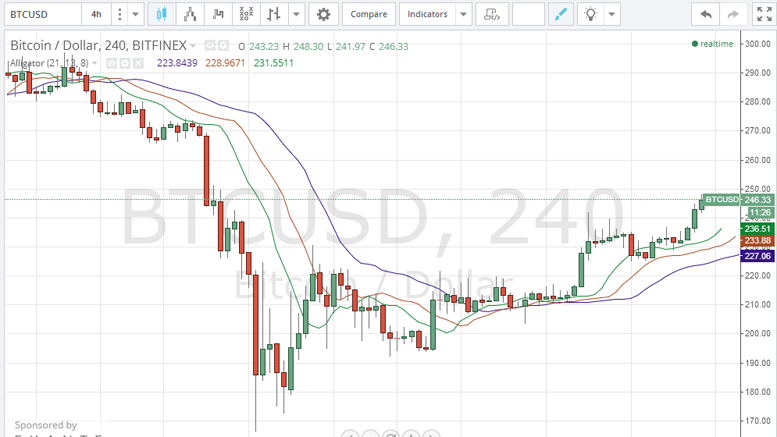
Bitcoin Price Upward Technical Analysis for 24/1/2015
Bitcoin price resumed its upward movement today as it rose from around $232 to over $247 at the time of the writing of this article. The buying volume of today's market seems to be pushing the price towards the $256 resistance line. By studying the 4 hour Bitfinex BTC/USD charts from tradingview.com (look at the below chart), we can see that the trading day started by forming four bullish (green) candles which points to today's market buying power, so we are likely to see the price increasing even more later today. By plotting the "William's Alligator" indicator on the same charts as we....
Related News

Bulls have faltered in their upward march and given to the bears an opportunity to gain control. As a result, technically important support levels have been breached which could lead to more losses in the value of Litecoin. In my previous analysis, From Resistance to Support!, I did mention that all the long positions must be built with strict stop-losses. Since the supports have been breached, a lot of long positions may have been squared. Litecoin is down 1.66% to $1.771 since yesterday. Technical analysis of the 240-minute LTC/USD price chart reveals that market participants should look....

Bitcoin briefly topped $250 for the first time since August 19, 2015, hitting a fresh monthly high of $250.09. We concluded the previous Bitcoin price technical analysis Retreats From Monthly Highs on a positive note saying that market participants should not be concerned about the drop and instead go long in Bitcoin near $242 for a target of $250. As can be seen, Bitcoin hit an intraday low of $242.82 before meeting the said target. Bitcoin is currently trading at $248.81, up 1.92 percent. And yes, we stand by our long call! bitcoin price chart. Below are the latest technical....

Bitcoin is trading under pressure as the Greek banks are supposed to open to the public today. Down 0.63% since our previous observation, Bitcoin has broken the upward sloping trendline, thereby creating a low-risk, shorting opportunity. Bitcoin is now trading at $276.09. In my analysis Buy, With Caution! I expressed that I expected a swift decline in the price in case the trendline was breached. Even though the support has been pierced and the price remains relatively flat, technicals have undergone a severe deterioration. Take a look at the technical analysis of the daily BTC-USD chart....

Bitcoin sinks for the third consecutive day as market witnesses profit booking. Yesterday's loss also meant that Bitcoin retested the support line of the upward sloping channel, but unfortunately, there are no clear technical indications as to whether the buyers will again lift the price up or will the bears pull the price further down. But keeping a close watch on some key technical levels will be of utmost importance. Bitcoin is currently trading at $242.98, down 0.53 percent since yesterday. Apart from the trading pattern, traders must also heed the below-discussed technical....

Trading with a slightly negative bias, Bitcoin has slipped to $244.28, down 0.94 percent yesterday. Even though the uptrend is intact, Bitcoin has failed to sustain above a key technical level which has led to severe deteriorations in the technical indicators. Let us discuss each of the factors in the technical analysis of the daily BTC-USD price chart below. Bitcoin Chart Structure - As has been marked in the chart above, the upward channel in which Bitcoin has been trading since the last week of September clearly holds. However, as discussed earlier, Bitcoin has failed to sustain above....