Bitcoin Price Technical Analysis for 31/1/2015 - Downtrend Still In Action
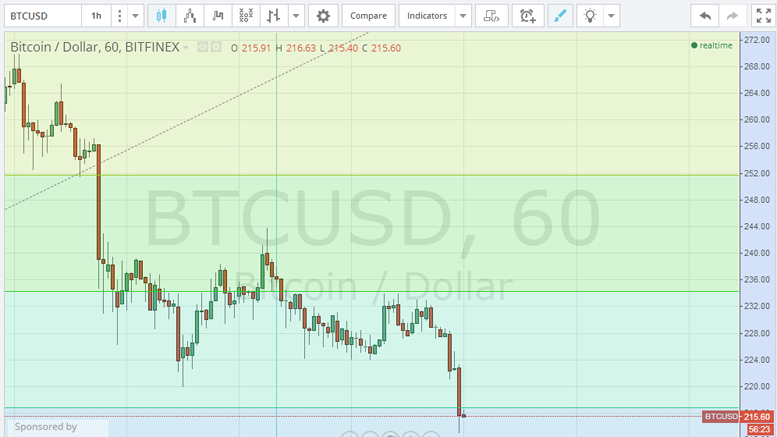
Bitcoin price continued falling yesterday proving how the bears are now taking over the market. With a continuation of the downtrend, $200 support level is not far away. Bitcoin price fell yesterday from around $232 to $217 at the time of writing of this article. The $230 level acted yesterday as a resistance level that resisted the attempt at revering the bearish trend. By studying the 1 hour Bitfinex (BTC/USD) chart from tradingview.com (look at the below chart), we can observe that bitcoin price has been between the 50% and 62% levels as per the Fibonacci retracements we plotted on the....
Related News
Bitcoin has been consolidating since hitting a low around 166. Price has rebounded above 300 briefly, and then retreated. Still, BTCUSD has been hanging onto the consolidation mode in what appears to be a triangle. With price action already so close to the triangle apex, a breakout is imminent, but it will not be of much significance by itself. Let's see what other technical clues we will need. Bitcoin (BTCUSD) 24/2/2015 Daily Chart. The daily chart shows that since price tagged 300, bearish candles have dominated. In fact, last Friday's bearish candle combined with the previous 4 daily....
Litecoin has soared more than 6% since yesterday to $3.909 on account of short covering as the cryptocurrency enters into consolidation mode. The rise has brought the price closer to the resistance level of $4.100. I had mentioned in my previous analysis No Relief Seen! that the market participants should not confuse the ongoing sideways action with a base formation. It must be noted that only above the resistance line will a base be confirmed, but until then, chances are that it remains in a lower top, lower bottom structure. Technical analysis of the daily LTC-USD price chart tells that....
Since the last Litecoin price technical analysis Will This Support Hold?, Litecoin has gained $0.067 or 2.45 percent to trade at $2.800. The better part is that Litecoin is currently in a short-term technical pattern which will lead to a big swing in the price. Read on below the latest technical considerations of the daily LTC-USD price chart. Litecoin Chart Structure - Upon a closer look at the price action of the past 6-7 sessions, it can be found that Litecoin has been trading in a small triangle. A triangle, which is a continuation pattern, in a downtrend implies that a bigger downmove....
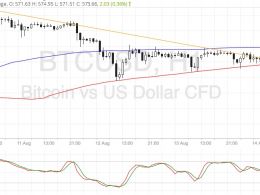
Bitcoin price could continue to drop after completing a correction to the area of interest at $580. Bitcoin Price Key Highlights. Bitcoin price is still trending lower on its short-term charts, following a break below consolidation and reversal formations. Price could pull up to the descending trend line on the 1-hour chart before resuming its slide, giving sellers an opportunity to catch the downtrend at a better price. Technical indicators are confirming that a downtrend could be in the works. Technical Indicators Signals. The 100 SMA is making a downward crossover from the 200 SMA to....
Neucoin Price Key Highlights. Neucoin price is on a downtrend, after breaking below a double top pattern earlier in the month. Price is also moving inside a descending channel since the start of the week and is on its way to test the resistance. Neucoin price could be in for yet another round of losses if the top of the descending channel continues to hold as resistance. Next Potential Support Level. If the selloff resumes around the current levels, neucoin price could make its way back down to the channel support near 0.000020. Stochastic is on the move down, which means that sellers are....


