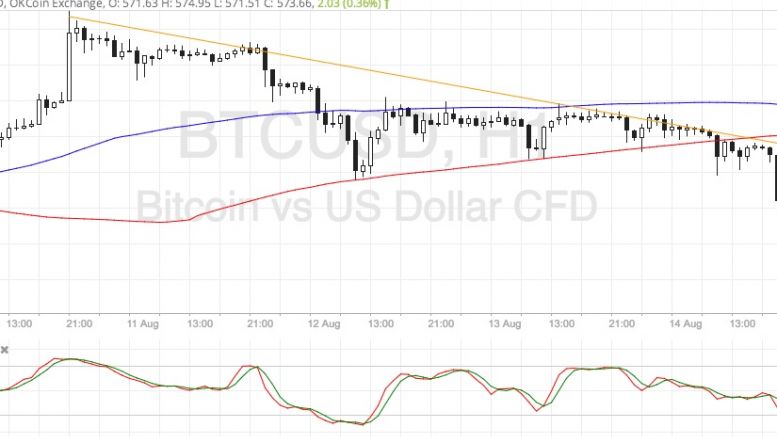
Bitcoin Price Technical Analysis for 08/15/2016 – Support Turned Resistance
Bitcoin price could continue to drop after completing a correction to the area of interest at $580. Bitcoin Price Key Highlights. Bitcoin price is still trending lower on its short-term charts, following a break below consolidation and reversal formations. Price could pull up to the descending trend line on the 1-hour chart before resuming its slide, giving sellers an opportunity to catch the downtrend at a better price. Technical indicators are confirming that a downtrend could be in the works. Technical Indicators Signals. The 100 SMA is making a downward crossover from the 200 SMA to....
Related News
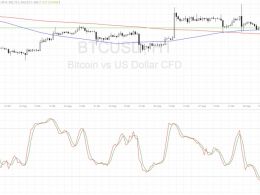
Bitcoin price is hovering above a resistance turned support area visible on the short-term time frames, still deciding whether to make a bounce or a break. Bitcoin Price Key Highlights. Bitcoin price is still treading sideways, moving above a resistance turned support level at $602. Price has formed lower highs on the 15-minute chart, suggesting that bullish pressure is weakening and that bears are trying to push for a move lower. For now, the area of interest is holding quite well since it lines up with the 100 SMA dynamic support. Technical Indicators Signals. The 100 SMA just recently....
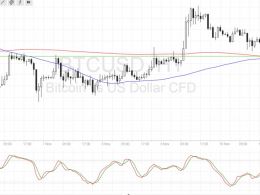
Bitcoin price pulled back from its recent rally and is finding support at a former resistance level. Bitcoin Price Technical Analysis. Bitcoin price is currently testing an area of interest and might be due for a bounce. The broken resistance around $715 is holding as support for the time being. Technical inflection points are also lining up with this area of interest. Technical Indicators Signals. The 100 SMA just crossed above the longer-term 200 SMA so the path of least resistance is to the upside. In addition these moving averages coincide with the former resistance around $715, adding....
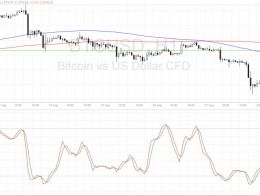
Bitcoin price is trending lower but is making a correction to an area of interest before resuming the selloff. Bitcoin Price Key Highlights. Bitcoin price recently broke below a short-term support area visible on the 1-hour time frame. Price found support around the $565 area before showing signs of pulling back. Bitcoin is now approaching the former support zone around $575, which might now hold as resistance. Technical Indicators Signals. The 100 SMA is below the 200 SMA so the path of least resistance is to the downside, which means that the downtrend could carry on. The 100 SMA is....
Ethereum price popped above a major resistance area of $11.80. Now, can it provide support and push ETH higher versus the USD? Ethereum price kept struggling near the $11.80 resistance area, as highlighted in yesterday’s post. However, the ETH bulls finally managed to take the price above the stated level, and there was an hourly close above it. Now, the price is moving down, and the same resistance area is currently acting as a support and helping the bulls to regain ground. There is an ascending channel pattern formed on the hourly chart (data feed via Kraken) of ETH/USD, which may play....

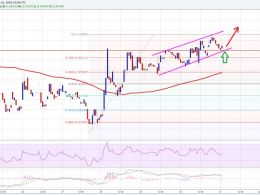
Bitcoin price could be ready to resume its climb now that this area of interest held as support. Bitcoin Price Technical Analysis. Bitcoin price recently made an upside breakout from a near-term resistance around $660. Price has found resistance at the $670 area and has since pulled back to the broken resistance, which appears to have held as support. This signals that bitcoin bulls could be ready to charge once more, although technical indicators are suggesting otherwise. Technical Indicators Signals. The 100 SMA is still below the longer-term 200 SMA so the path of least resistance is to....