
Bitcoin Trading Pulls Correction Deeper
Bitcoin trading, today, sacrificed the technical advantage it had gained from Friday's advance above long-term resistance. The market had already successfully tested the trendline on the day but returned to it in a cynical sell-off during Sunday trade. This analysis is provided by xbt.social with a 3 hour delay. Read the full analysis here. Bitcoin Trading and Price Analysis. Time of analysis: 14h38 UTC. Bitstamp 15-Minute Chart. From the analysis pages of xbt.social, earlier today: The technical chart conditions are similar to the sell signal they gave prior to the drop visible on the....
Related News

Bitcoin price in a flash is now well below $40,000, reaching as low as $30,000 this morning during the chaos. The selloff is the worst since Black Thursday last year at the onset of the pandemic, but things could still go a lot deeper. Here’s what data says about assets – even cryptocurrencies – when […]

Bitcoin price decline pulls deeper into the consolidation zone around $650. Below $640 there is a freefall zone to $600, yet a reversal at $640 cannot be ruled out. The Bitstamp 4hr candle chart shows a broad overview of the final large wave to the June high, followed by a correction that quickly slammed down to $560. Subsequent price action had been ambiguous while price went through the paces of a correction – rendering the indicators mostly useless and leading the market into two bull traps prior to slumping once more. On the weekend two declining scenarios were considered: 1) a large....

XRP stands at a pivotal point as it approaches the $2.97–$3 resistance zone. Holding above this level could confirm bullish momentum and spark the next Wave 3 rally, but a rejection here risks triggering a deeper correction. Perfect Retest: $2.79 Support Holds Strong CasiTrades, a crypto analyst, recently shared an update on XRP’s ongoing market structure, pointing out that the backtest of the $2.79 support level was flawless. According to CasiTrades, this was precisely where momentum was expected to re-enter the market, and buyers have indeed shown strength at this zone. She emphasized....

Ethereum is currently undergoing a price correction, slipping below key levels as selling pressure grows across the broader market. Despite this pullback, institutional interest in ETH remains resilient, with major players continuing to add aggressively to their holdings. Analysts have raised the possibility of a deeper correction, pointing to mounting volatility and the inability of […]
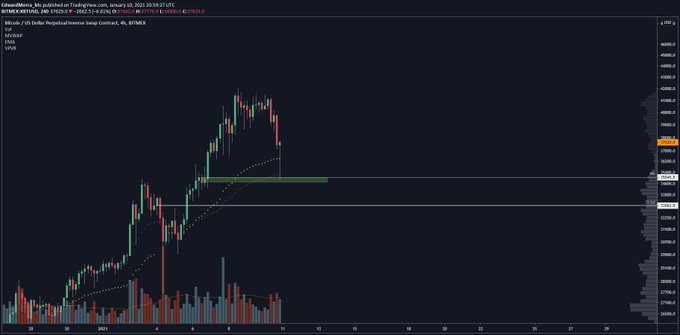
Bitcoin plunged as low as $34,500 on top spot exchanges last hour as selling pressure picked up ahead of the weekly close. The cryptocurrency fell as low as $35,000 on futures exchanges as well, though spot sellers were leading the correction. While some began to fear that a deeper correction was in store, buyers stepped […]