
Bitcoin Price Analysis: Last Chance At $640
Bitcoin price decline pulls deeper into the consolidation zone around $650. Below $640 there is a freefall zone to $600, yet a reversal at $640 cannot be ruled out. The Bitstamp 4hr candle chart shows a broad overview of the final large wave to the June high, followed by a correction that quickly slammed down to $560. Subsequent price action had been ambiguous while price went through the paces of a correction – rendering the indicators mostly useless and leading the market into two bull traps prior to slumping once more. On the weekend two declining scenarios were considered: 1) a large....
Related News

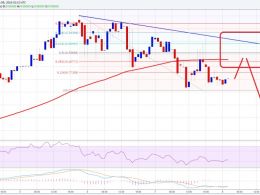
A longer-term view of the Bitcoin price chart shows that the moving averages are more closely compressed - and aligned - than they have been in over a year. Price action has narrowed in range and is tending toward $240 and 1480 CNY. This analysis is provided by xbt.social with a 3 hour delay. Read the full analysis here. Not a member? Join now and receive a $29 discount using the code CCN29. Bitcoin Price Analysis. Time of analysis: 14h02 UTC. Bitfinex 4-Hour Chart. Why The Preference For BTC-China Charts In Analysis? From the analysis pages of xbt.social, earlier today: Failing to....
Ethereum price traded down near $7.0 where buyers appeared. Currently, it looks like there is a chance of ETH/USD breaking higher in the short term. Ethereum price ETH made a perfect bottom near $7.0. I highlighted in yesterday’s analysis that there is a chance of ETH/USD moving down towards $7.0, which can then produce a bounce. The price did test the mentioned level and moved higher later. There was a nice upside reaction, signaling more gains in the near term. ETH/USD is currently attempting to break a bearish trend line on the hourly chart (data feed via Kraken), which is also....
Ethereum price traded down finally and also moved back below $10.0. It looks like there is a chance of a minor correction moving ahead. Intraday Support Level can be $9.07. Intraday Resistance Level may be $10.5. Ethereum price as highlighted yesterday made a new high of $11.98 where it found sellers and started to move down. The price also traded below the $10.0 level, which is a sign that bulls stepped back and failed to prevent losses. If the bears manage to gain strength, then there is a chance of more losses in the near term.

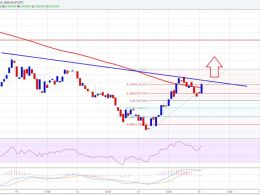
Bitcoin price has, during the past three days, formed a series of lower highs and higher lows in a pattern that resembles the consolidation prior to a decline. There are technical indications that a pull lower is on the cards, but it may not get far. This analysis is provided by xbt.social with a 3-hour delay. Read the full analysis here. Not a member? Join now and receive a $29 discount using the code CCN29. Bitcoin Price Analysis. Time of analysis: 15h00 UTC. Bitfinex 1-Hour Chart. From the analysis pages of xbt.social, earlier today: The Bitfinex 1-hour chart shows the decline since the....

A strong drop from yesterday's consolidation zone saw the Bitcoin price retrace 50% of the previous five wave advance. The question is now whether a bottom has been struck or whether more downside is due. This analysis is provided by xbt.social with a 3 hour delay. Read the full analysis here. Not a member? Join now and receive a $29 discount using the code CCN29. Bitcoin Price Analysis. Time of analysis: 13h37 UTC. BTC-China 15-Minute Chart. Why The Preference For BTC-China Charts In Analysis? From the analysis pages of xbt.social, earlier today: With 50% of the prior advance retraced,....