Bitcoin Price Technical Analysis for 17/3/2015 - Lackluster Moves
The highly volatile digital currency seems to have gone into a hibernation mode, barely moving in the past one week. As mentioned inyesterday's analysis, the bulls are finding it tough to pose serious threats to the shorts as Bitcoin still lingers around $290. Technical analysis on the 240-minute BTC/USD price chart reveals that the consolidation period may extend for a while. Moving Average Convergence Divergence - The Signal Line is slowing catching up with the MACD and as a result, the Histogram value is retracting to 0. A declining Histogram value indicates that the bulls are losing....
Related News
Consistent with yesterday's analysis, Lackluster Moves, Bitcoin has been bogged down by profit booking and minor selling, and has reached the crucial Support Line 1. This support level has been reaffirmed several times before, and hence, any breakdown below this could lead to a free fall in the Bitcoin price. By technically analyzing the BTC/USD 240-minute price chart, my recommendation is to sell on the rise. Here are some technical considerations which push me to this conclusion. Lower Top Confirmed - The technical indicators had for long been pointing to a fading bullish momentum and....
Bitcoin is seeing a tepid start to this week as neither the bulls nor the bears exert any pressure on the other. The cryptocurrency looks relatively calm in the low-volume season, as do the technical indicators. Market participants should refrain from excessive trading in such conditions. Bitcoin is currently trading at $421.53. The technical indicators overlaid on the 4-h BTC-USD price chart from BITSTAMP are giving mixed signals. This, coupled with the lackluster price action, is compelling me to advise that this is a no-trade market, and one should wait for better opportunities to....
Litecoin has broken out from the two-week trading range we discussed in the previous Litecoin price technical analysis titled Range Trading? as positivity from the Bitcoin market spills over. Litecoin is currently trading at $2.887. Though a breakout may seem as the best indication for the market participants to go long on Litecoin, my advice would be to wait for a close above $2.950 or buy on a dip. But, why do I say this? Read on the technical indications below to find out. I still find the technical indications fairly mixed and therefore, require stronger signals or a low-risk....
The action in Litecoin market in the past 24 hours has been muted. The cryptocurrency has failed to move even intraday and is now trading on a flat note at $2.979. There are two factors suppressing the movement in Litecoin: Overhead Technical Resistances. Lackluster Bitcoin Market. Both of these overhangs should be dealt with quickly if Litecoin is to maintain its positive stance. According to the latest LTC-USD price technical considerations, Litecoin needs only a little upward thrust to secure more gains. Litecoin Chart Structure - The chart structure remains positive until this moment.....
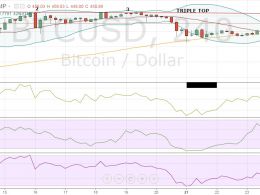
The Christmas isn’t turning out to be merry for Bitcoin. The cryptocurrency is struggling near the overhead resistance of $465. It is now trading 1.28% lower at $450.89, raising concerns that the market participants might pull out their funds in the holiday season. As a result, several technical indicators are also showing declines. We advised in the previous Bitcoin price technical analysis Target Achieved that traders should book at least partial profits in their long positions. And for today’s analysis, we will again be using the 4-h BTC-USD price chart from BITSTAMP.


