Bitcoin Price Technical Analysis for 24/3/2015 - Crucial Climb
The Bitcoin price is little changed from yesterday and is still hovering near the crucial level of $265. But, the chart structure has witnessed a dent and the hopes of reaching $280 are now hinged on the upward sloping Short-term Support (marked in the chart below). An analysis of the BTC/USD 240-minute price chart has been presented here. Chart Structure - In my yesterday's BTC/USD analysis titled Support Established, I mentioned that Bitcoin had broken out from the contracting channel and was sustaining above $265. But, in the past 12 hours, the digital currency has cracked below this....
Related News
Sellers continue to run amok in Darkcoin as the price plunges to new lows. Thanks to the sell-off, each Darkcoin has gotten significantly cheaper and can be bought for 0.0172BTC. Investors may also consider adding to their long positions as the price nears a crucial support level. The 240-minute DRK/BTC price chart above, taken from bitcoinwisdom.com, has been analyzed using technical analysis to reveal some noteworthy points from a trading perspective. Chart Structure - The price trend has been disappointing, to say the least. Ever since Darkcoin hit a high of 0.02495BTC, price has been....
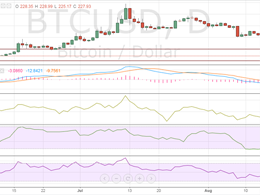
In the previous Bitcoin price technical analysis Rebounds, we discussed how the cryptocurrency was erasing the losses for the past week. But, the entire positivity was put to rest over the weekend as bears made a comeback and long positions were fast liquidated at the slightest hint of a pullback. Bitcoin, which is now trading at $227.93, has once again come closer to its important buying interest zone of $220-225. As the price decline has pushed the price closer to its crucial support, market participants may also be factoring in a breach of support this time, but I would recommend....
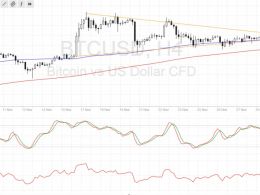
Bitcoin price followed through with its consolidation breakout and sustained its climb. Bitcoin Price Key Highlights. Following the recent upside breakout from the symmetrical triangle pattern, bitcoin price continued to climb as predicted in the earlier post. Price has now made its way to the triangle highs around $780 and is showing increased buying pressure to form new highs. Technical indicators are giving mixed signals at the moment, but it looks like the odds are in favor of more bullish action. Technical Indicators Signals. The 100 SMA is above the 200 SMA so the path of least....
Litecoin falls 1.47 percent to $3.075 after kissing the resistance at $3.130. In the previous Litecoin price technical analysis, we said that Litecoin could leapfrog to higher levels on consistent support from the buyers, but what we have got instead is a bout of profit booking which once pulled down the price to an intraday low of $3.050. But can this decline prove fatal to Litecoin? Will the crucial support of $3.000 be breached? Let us try to find that out by conducting a technical analysis on the daily LTC-USD price chart. Litecoin Chart Structure - As can be seen, the higher top,....
Litecoin rises 2.92 percent to $3.098 as it breaks away from the consolidation phase which lasted for 7 consecutive days. This is also the highest closing level for Litecoin in over a month. The rise in Litecoin could also be partly attributed to a strong surge in Bitcoin on the back of a strong momentum breakout. Helped by the price jump, Litecoin is now in the sniffing distance of a crucial overhead resistance which we discussed in the previous Litecoin analysis In a Fix? Below are the latest technical considerations taken from the daily LTC-USD price chart. Helped by the price jump,....


