Bitcoin Price Technical Analysis for 26/3/2015 - Volatile Play
It seems that the Bitcoin price is now at the mercy of the bears, because bulls seem to have lost all control. In my yesterday's analysis, I mentioned that the cryptocurrency has been violating crucial support levels, which makes it a perfect sell-on-rise candidate for a target of $230. In the past 24 hours, the digital currency is little changed from $246.88 to the current $245.27. However, it was not without its fair share of volatility as the price slumped 4% intraday to a low of $236 before quickly pairing the losses. I expect volatility to remain an integral part of the upcoming....
Related News
Litecoin gave us another glimpse of its highly volatile nature in yesterday's trading session. In my previous analysis titled Sky is the limit, I had reiterated my opinion that Litecoin is expensive and should be avoided at current levels. Bullish participants may have realized the same when the cryptocurrency had a knee-jerk reaction. Litecoin is presently trading down 3.06% at $5.214. Looking at the 240-minute LTC-USD price chart, I can say that technical indicators are currently giving conflicting signals while the chart structure remains firm. Litecoin Chart Structure - At one point of....
Many times, our readers ask why we use technical analysis for a volatile asset such as Bitcoin. There have been several instances when my price predictions based on technical analysis have gone horribly wrong. But I must admit that it is not exactly a cakewalk to anticipate the future price movements of a security which is yet to be tagged as ‘stable.’ In this article, I will discuss all the factors that deeply affect the action in Bitcoin markets, and why trading with technicals is a tough job for price analysts. China Drives the Bitcoin Market – In March 2015, Goldman Sachs revealed in a....
It seems that the big negatives I mentioned in my previous analysis are coming into play, and well. Since yesterday, Litecoin has crashed in excess of 12% and is now trading at $3.980. If Litecoin fails to recover these losses and closes today's session below the strong support of $4.100, we may see a huge decline of 25% in the coming sessions. And I strongly believe that we will see lower levels. Let's take a look at the technical analysis of the daily LTC-USD price chart above. Litecoin Chart Structure - Litecoin had been consolidating above the support level for a considerable time,....
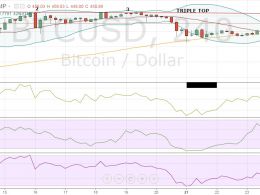
The Christmas isn’t turning out to be merry for Bitcoin. The cryptocurrency is struggling near the overhead resistance of $465. It is now trading 1.28% lower at $450.89, raising concerns that the market participants might pull out their funds in the holiday season. As a result, several technical indicators are also showing declines. We advised in the previous Bitcoin price technical analysis Target Achieved that traders should book at least partial profits in their long positions. And for today’s analysis, we will again be using the 4-h BTC-USD price chart from BITSTAMP.
Bitcoin has crossed the crucial resistance mentioned in A Breakout Everybody's Waiting For!, rising roughly 1.54% to trade at $235.75. The price appreciation has also led to overbought valuation for Bitcoin which might face stiff resistance from the next supply region at around $238. So, should you be buying Bitcoin now or not? Let's find out in the technical analysis below! Technical analysis of the above presented 240-minute BTC/USD price chart indicates that bulls have complete control over the situation and that Bitcoin is a pure buy-on-dips play. Bitcoin Chart Structure - After....


