Bitcoin Price Technical Analysis for 27/3/2015 - Mighty Bears
At the current price of $247.66, Bitcoin is trading more than 2% down from its 24-hour high of $253.75. The downward trend is still evident in the digital currency and bears are entering the market on every rise. It is also expected that volatility will play a major role in the price action going ahead. Presented here is the technical analysis of the 240-minute BTC/USD price chart which makes a strong case for the sellers. Fibonacci Retracements - As can be seen from the chart above, the rise from yesterday's $245.27 to a high of $253.75 was considerably subdued by fresh selling.....
Related News
Litecoin has gone berserk after breaking out of the trading channel post a brief period of sideways consolidation. The price has jumped an earth shattering 59% since yesterday to hit a fresh 2015-high of $3.194. As the cryptocurrency loses some steam, the price has come down to $2.850. Litecoin's latest price action would have killed the bears, or at least made them broke. But now, even with the unprecedented rise in bullish strength, it isn't worth to buy Litecoin when it has attained stratospheric valuation. Technical analysis of the 240-minute LTC-USD price chart conveys that the....
Litecoin bears have been smoked by the massive 27% rally in the past 24 hours following a high volume breakout from the range I discussed in my previous analysis, New Range. The surreal rise in Litecoin price has also pushed it to the highest level of 2015. Litecoin is currently trading at $3.871, a strong advance from yesterday's $3.047. Litecoin's jump to a fresh 2015-high closely follows Bitcoin's leap to a new June high, as the Greece crisis comes to its D-day. A technical look at the 240-minute LTC-USD price chart above tells that Litecoin has entered the "no-buy" zone due to its....
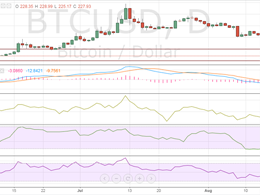
In the previous Bitcoin price technical analysis Rebounds, we discussed how the cryptocurrency was erasing the losses for the past week. But, the entire positivity was put to rest over the weekend as bears made a comeback and long positions were fast liquidated at the slightest hint of a pullback. Bitcoin, which is now trading at $227.93, has once again come closer to its important buying interest zone of $220-225. As the price decline has pushed the price closer to its crucial support, market participants may also be factoring in a breach of support this time, but I would recommend....
Bitcoin is seeing a tepid start to this week as neither the bulls nor the bears exert any pressure on the other. The cryptocurrency looks relatively calm in the low-volume season, as do the technical indicators. Market participants should refrain from excessive trading in such conditions. Bitcoin is currently trading at $421.53. The technical indicators overlaid on the 4-h BTC-USD price chart from BITSTAMP are giving mixed signals. This, coupled with the lackluster price action, is compelling me to advise that this is a no-trade market, and one should wait for better opportunities to....
The mighty bulls are back! After taking adequate rest and catching enough breath, they have made a powerful comeback and exposed the frailty of the short-sellers. Backed by strong sentiments, Litecoin is now challenging a crucial resistance level. Litecoin is currently trading up 2.8% at $1.865. From a technical perspective, things look very positive for the virtual currency. An analysis of the 240-minute LTC-USD price chart tells that Litecoin should threaten previous tops unless bulls lose complete control of the situation. Litecoin Chart Structure - A closer look at the chart reveals....


